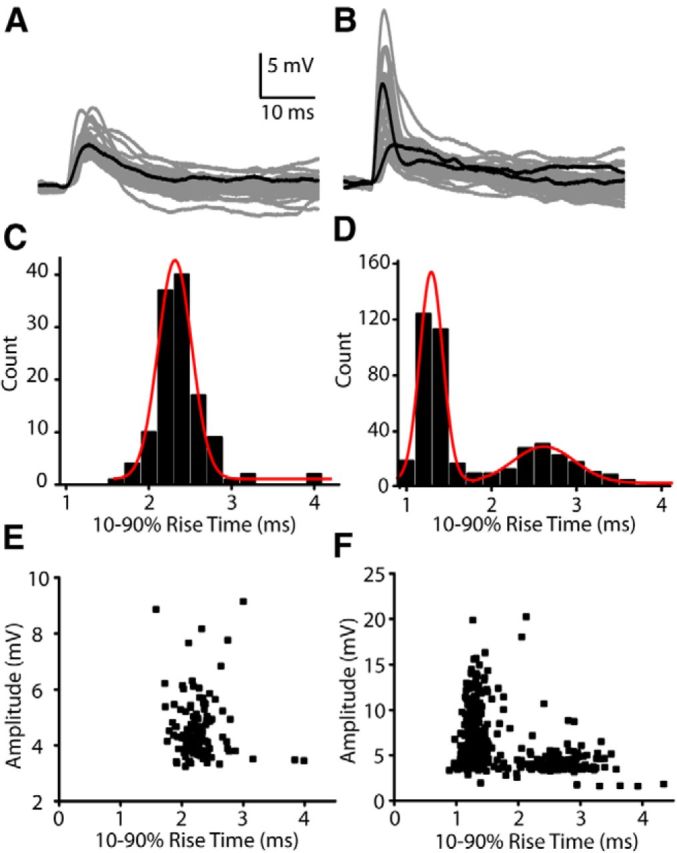
Figure 2.

Two subsets of EPSPs in type II afferent neurons. A, Fifty overlaid EPSP traces recorded from a representative type II neuron dendrite. B, Fifty overlaid traces from a different neuron with a mixed population containing some EPSPs with amplitudes and kinetics similar to those in A, and an additional population of larger EPSPs with faster rise times. C, Frequency histogram of EPSP rise times from the same cell as in A. A Gaussian fit to the data has a center at 2.33 ms. D, Frequency histogram of EPSP rise times from the same cell as in B. Data can be fit with two Gaussian curves, with centers at 1.29 and 2.62 ms. E, Plot of amplitude by rise times for EPSPs from same cell as in A, C. F, Plot of amplitude by rise times for EPSPs from same cell as in B, D.
