
Figure 4.
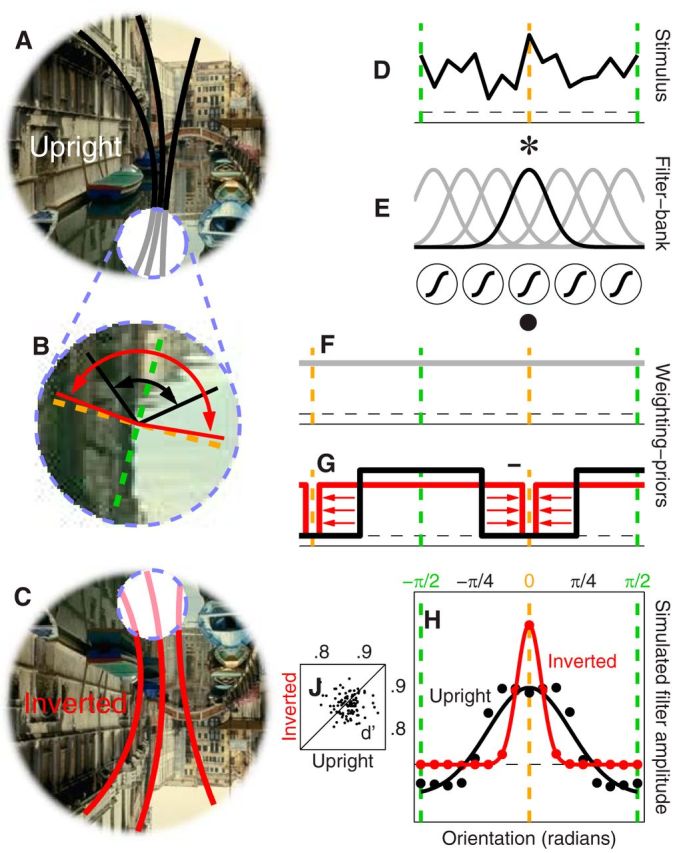
Top-down predictive model of orientation tuning. A–C, Summarize the model qualitatively. D–G, Show its architecture in more detail. The model exploits the edge structure of the scene to project an expected orientation range onto the probe region (indicated by dashed blue circle) similar to a filling-in process (black lines in A fill into gray lines). This process is less precise under inversion (C) so that the projected orientation range is broader for inverted (red) than upright (black) configurations (B). Software implementation involved filtering of the input stimulus (D) via a bank of oriented units (E); the output from this layer was subjected to a sigmoidal nonlinearity ( symbols in E) and weighted by an isotropic prior (F) minus the predicted orientation range (G), thus returning the degree of incongruency associated with the stimulus. The model was challenged with the same stimuli used with human observers and on each trial selected the stimulus associated with largest incongruency as returned by the read-out rule in F and G. The associated orientation tuning functions (H) capture most features observed in the human data (compare with Fig. 1G; smooth traces were obtained via the same fitting procedure). J, Plots sensitivity for upright versus inverted configurations (each point refers to 1 of 100 model iterations, 10 K trials per iteration).