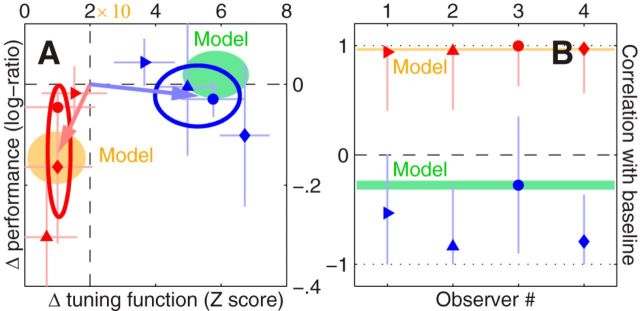
Figure 6.
Inverting the movie changes performance, playing it backward changes directional tuning. Values on y-axis in A plot log-ratio sensitivity (similar to Fig. 3C) for inverted (red) or reversed (blue) d′ values versus corresponding upright values; x-axis plots RMS of the tuning function obtained by subtracting either inverted or reversed directional tuning function from its upright counterpart (red/blue vs black traces in Fig. 5F) in units of expected deviation from measurement noise (see Materials and Methods). B, Plots point-by-point correlation between inverted/reversed (red/blue) and upright tuning functions across observers (x-axis). Different symbols refer to different observers preserving the same symbol-to-observer labeling adopted in Figure 3. Error bars indicate ± 1 SEM. Shaded orange and green areas show ranges (mean ± SD across simulations) spanned by the model outlined in Figure 7; x scaling in A has been stretched by one order of magnitude (×10) for model to accommodate the inevitably higher precision afforded by the simulations (model has no intrinsic noise).

