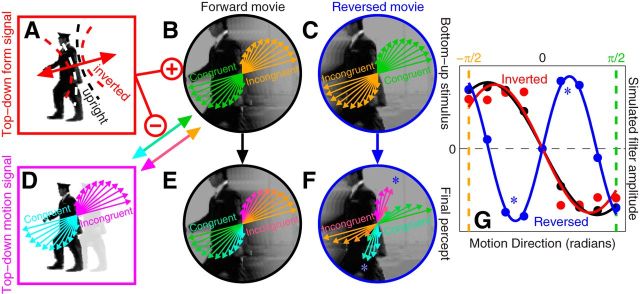
Figure 7.
Top-down predictive model of directional tuning. This model incorporates the orientation tuning model (Fig. 4) as its form module (A): the projected orientation range (dashed lines in A) is less precise under inversion (red dashed lines) and is aligned with the local edge content. This module sends a facilitatory signal to the bottom-up motion module (B) and an inhibitory signal to the top-down motion module (D), thus controlling the balance between bottom-up and top-down directional processing within the system. The form module itself is not directionally selective in that its modulation is symmetric with respect to the motion directions defined by the edge (double-headed arrow in A). The relative contribution of bottom-up and top-down directional filtering to the final percept at different directions is indicated by different colors: green/orange for bottom-up, cyan/magenta for top-down. Green bottom-up units respond to the congruent direction (i.e., the one defined by the low-level properties of the stimulus) and they are coupled with the top-down cyan units, which respond to the direction congruent with the semantic content of the scene (i.e., the one defined by the higher level properties of the stimulus); orange bottom-up units are similarly coupled with magenta top-down units (coupling is represented by multicolored double-headed arrows). When the movie is played in its normal configuration (forward), bottom-up (B) and top-down (D) representations of congruent and incongruent directions agree with each other, so that the final percept (E) matches both. When the movie is played backward (reversed), the two representations are opposite to each other (C vs D) and the final percept (F) presents distortions from the veridical direction in the stimulus (C) introduced by the top-down motion module; the distortions are more pronounced away from congruent/incongruent directions because the form module (A) allows progressively more input from the top-down motion module within that region of directional space. When the model is challenged with the same stimuli and analysis used with human observers it is able to capture most features of the human data (compare G with Fig. 5F; see also shaded regions in Fig. 6). Quantitatively simulated distortions in G are linked to those diagramed in F using asterisks. G shows average across 100 iterations (9 K trials each).

