
Figure 8.
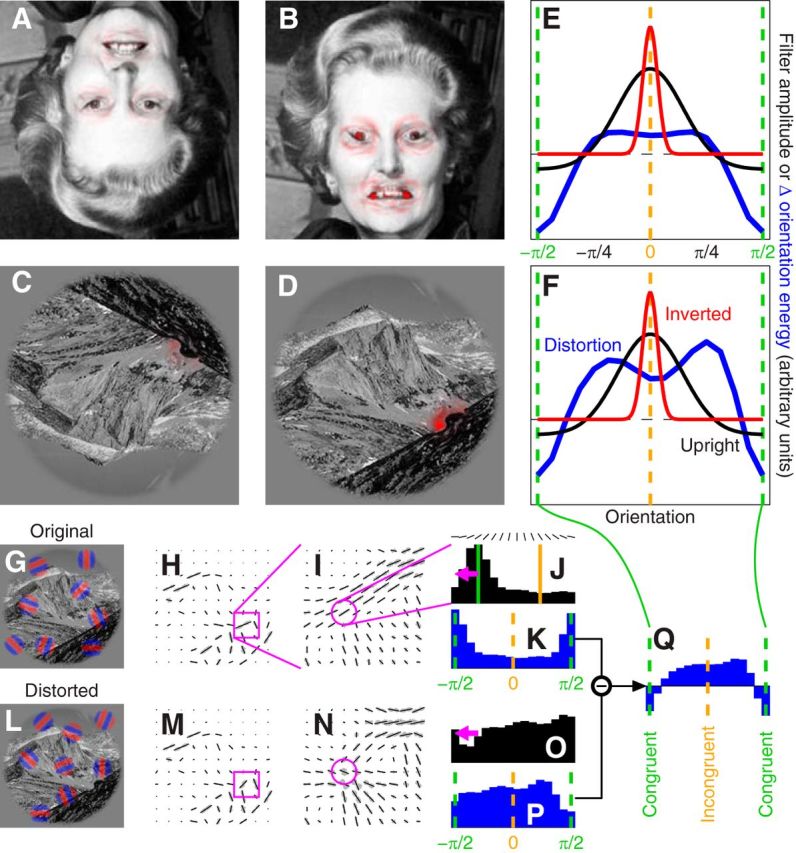
The face/scene inversion effect explained. A–D, They are the same images as shown in Figure 2, A–D, with superimposed output (red tint) from inverted (A, C) and upright (B, D) human orientation-selective filters (red and black traces in E and F) in response to the orientation energy introduced by local distortions in the original images (blue traces in E and F). The latter was computed by applying (via convolution) a set of quadrature-pair oriented Gabor patches (see red–blue examples in G) and taking the sum of their squared outputs (oriented energy), resulting in the orientation-energy map shown in H where orientation energy at sample locations in the image is plotted using oriented segments of length matched to the energy content for the corresponding orientation (maximum-energy orientation is plotted in black, others in gray). I, Resamples local square region of image where distortion was applied (indicated by magenta square region in H). J, Plots energy distribution for a specific location (indicated by magenta circle in I). The same analysis was applied to the distorted image (L) to obtain corresponding orientation maps (M and N) and energy distribution (O). The orientation associated with maximum energy content at each specific location in the original (undistorted) image (indicated by vertical green line in J) was labeled as congruent, and both undistorted and distorted distributions were realigned by the same amount (indicated by magenta arrows in J and O) so that the congruent orientation would correspond to − π/2 on the x-axis (and the incongruent orientation to 0); example realigned distributions are shown in K and P. We then subtracted the original distribution (K) from the distorted distribution (P) to obtain the change in energy distribution introduced by the distortion (Q). Blue traces in E and F show averages across entire image; orientation filters (from fits to human data in Fig. 1G) were applied not to the average but separately to each pixel in the image to estimate perceived distortion energy (red tint in A–D) across the scene.