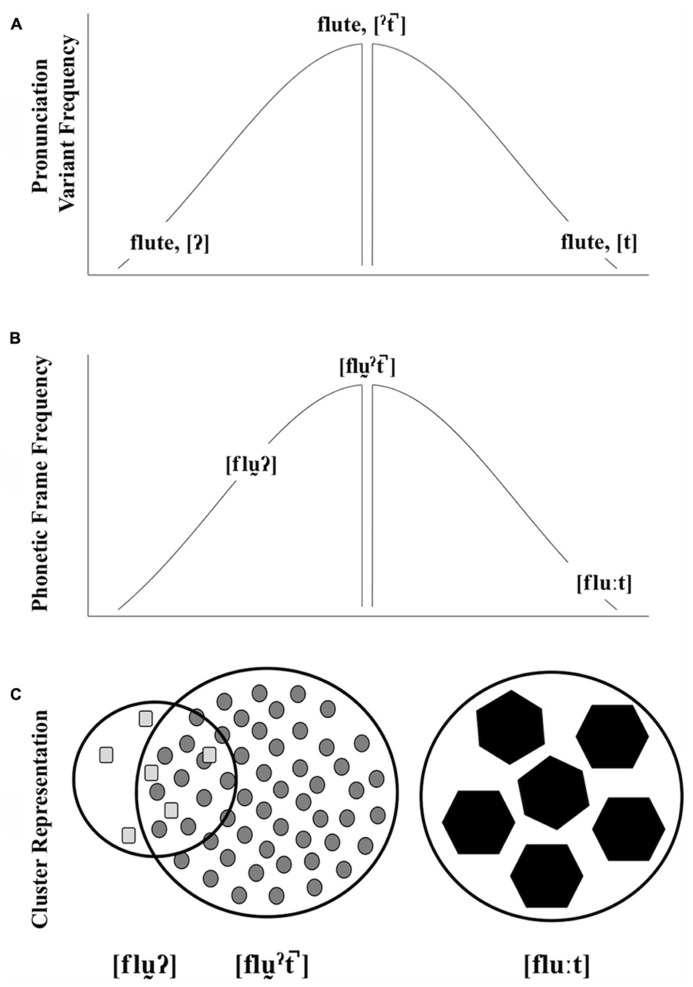
FIGURE 1.
A schematic illustration of pronunciation variant frequency (A), phonetic frame frequency (B), and cluster representation (C) for words ending in three t-final variants (used here as symbolic of other kinds of variation). As depicted, the frequency of two atypical pronunciation variants may be the same, but their relationship to the typical production may differ in terms of word-level phonetic variation. In our schematic, cluster representations, shape corresponds to pronunciation variant, cluster size corresponds to cluster robustness, and token size corresponds to encoding strength. The overlap between the atypical glottal-final form and the typical glottalized, unreleased-final form represent the typicality benefit applied to the atypical form.

