
Figure 1.
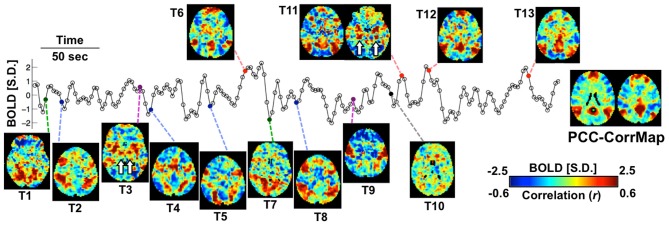
Spontaneous activity at single fMRI time frames is suggestive of varying network involvement. Sample frames (T1-T13) from a representative fMRI scan show clear, distinct spatial patterns, some of which (red points) resemble the DMN pattern demonstrated by the PCC-based correlation map of this subject (right). The fMRI time course represents signal from the PCC seed region (green square). Small structures indicated by white arrows are the hippocampus (HI) and posterior parahippocampal gyrus (PHG) in T11 and the ventral lateral nucleus (VL) in T3. The color bar represents normalized BOLD signal for the sample frames and correlation values for the seed-based correlation map.