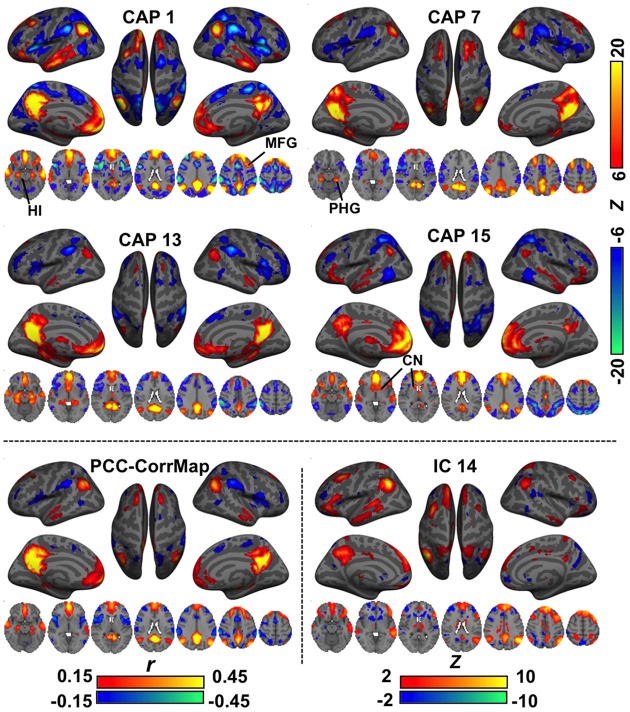
Figure 2.
Comparison of CAPs with the DMN derived from conventional analysis methods. CAPs 1,7,13,15 coarsely resemble the DMN pattern, but differ in detail. For example, CAP 1, 3, and 15 show specific co-activations at the hippocampus (HI), parahippocampal gyrus (PHG), and caudate nucleus (CN), respectively. For comparison, the DMN was also derived from PCC-based correlation (PCC-CorrMap, bottom left) and ICA (IC 14, having the highest spatial correlation with the PCC-CorrMap, bottom right). Both methods failed to extract multiple patterns of DMN seen in the CAPs.

