
Figure 5.
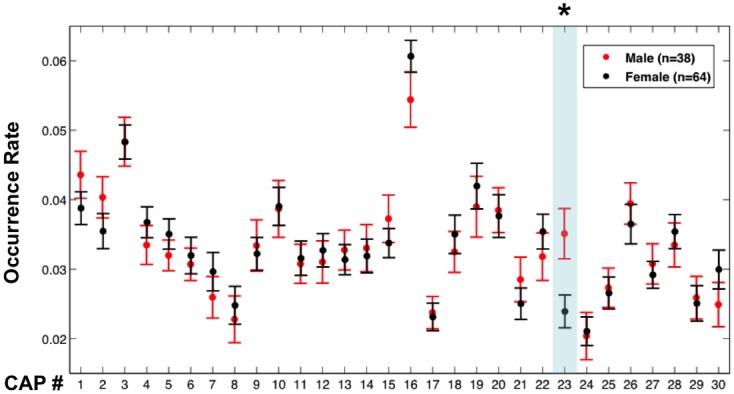
Occurrence rates of the CAPs in males and females. Error bars represent the standard error across participants. The asterisk and light blue shadow indicates CAPs showing a significant difference in their occurrence (p < 0.01 with Bonferroni correction, permutation test) between these two groups.