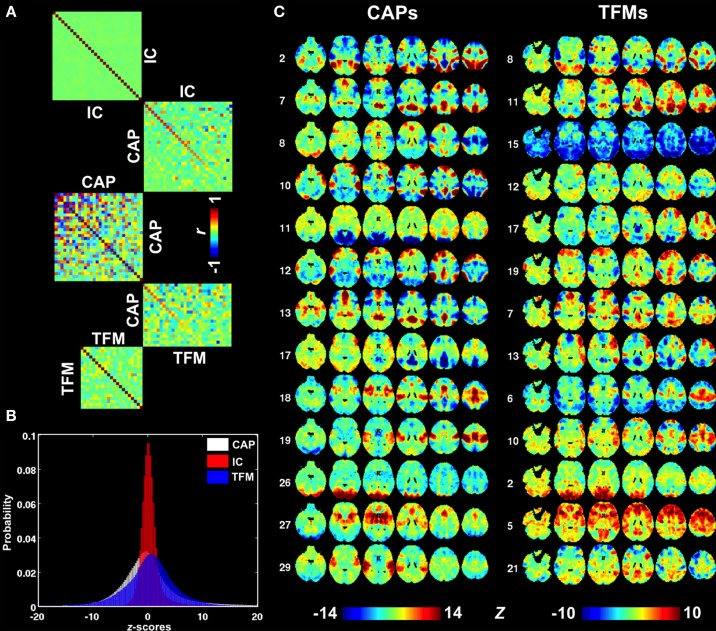
Figure 6.
Comparison between CAPs, ICs, and TFMs. (A) Spatial cross correlation matrices indicating substantial differences between CAPs (middle) on one hand and ICs and TFMs on the other (top and bottom, respectively). Cross-modality correlations were sorted based on correlation strength. (B) Distributions of map statistics (z-statistics) for CAPs (white), ICs (red), and TFMs (blue). IC statistics show a very non-Gaussian distribution with a elevated right tail, consistent with the independence assumption of ICA. (C) A selection of best-matched CAPs and TFMs, based on spatial similarity.

