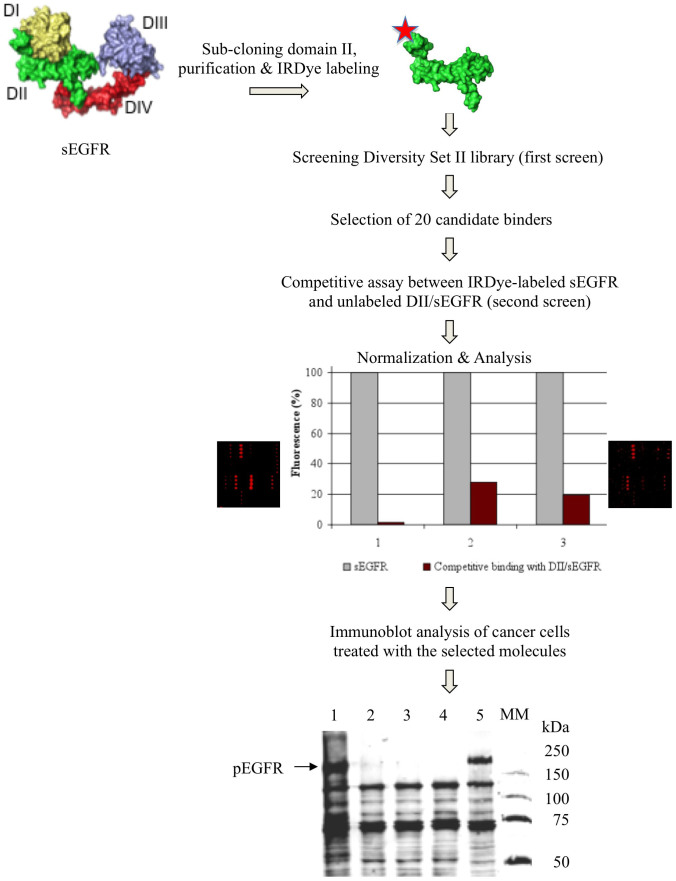
Figure 1. Schema of compound library screening with microarrays and identification of small molecules enhancing protein tyrosine phosphorylation of EGFR.
The structure of the sEGFR is shown in a tethered conformation of four domains: I (yellow), II (green), III (gray) and IV (red). The histogram shows competitive assay data obtained for three selected compounds (for NSC 228155 - column 1). The signal monitored from binding of each molecule to sEGFR (gray column) was used as 100% to assess the binding efficiency to sEGFR in competition with DII/sEGFR (brown column). Protein tyrosine phosphorylation was assessed in MDA MB468 cells exposed to the compounds at 20 μM final concentration for 60 min at 37°C. The proteins were analyzed with anti-pTyr P100 antibody. Lane 1: cells exposed to NSC 228155; lanes 2 and 3: cells exposed to two other selected compounds; lane 4: untreated cells; lane 5: cells treated with 150 ng/ml EGF for 10 min; MM: molecular mass markers, kDa.

