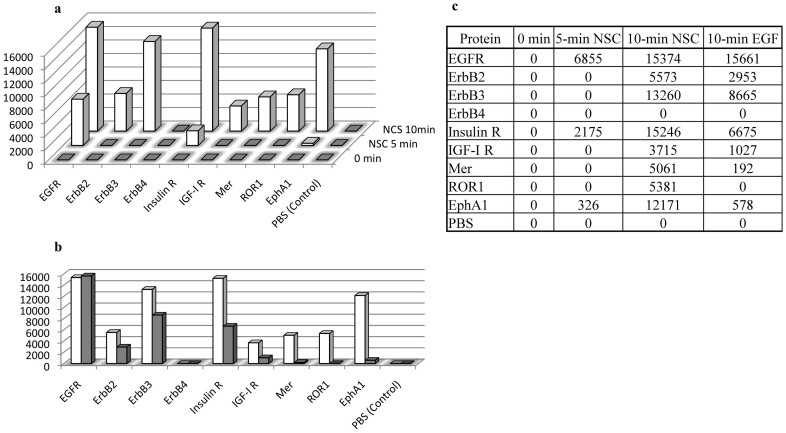
Figure 4. Time-dependent activation of RTKs in MDA MB468 cells exposed to NSC 228155 (a, c) and comparison of protein tyrosine phosphorylation in cells exposed to NSC 228155 versus EGF for 10 min (b, c).
Tyrosine phosphorylation levels of RTKs were assessed after 5-min and 10-min exposure to 100 μM NSC 228155 or 10-min exposure to 150 ng/ml EGF. Histograms show the arbitrary level of protein tyrosine phosphorylation determined in NCS 228155 (white column) and EGF (gray column) treated cells. The rate of tyrosine phosphorylated RTKs was quantified by normalization with control spots according to the manufacturer's protocol (R&D Systems).

