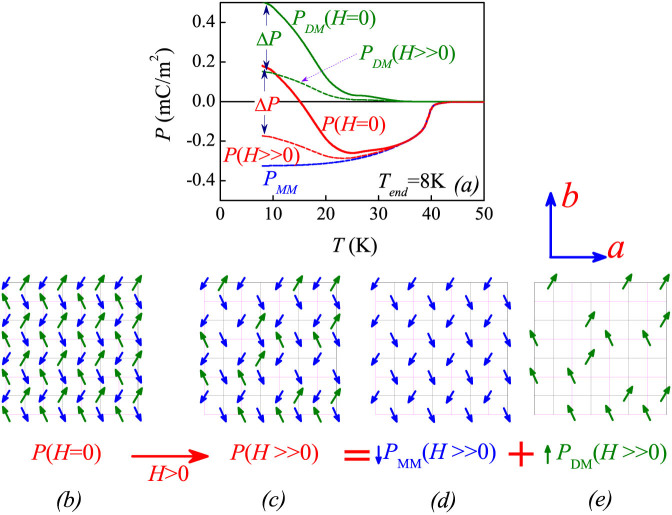
Figure 8. Measured ME responses and proposed model.
(a) The measured P(T) curves and proposed PMM(T) and PDM(T) curves under H = 0 and H ≫ 0 (e.g. ~2 T). It is suggested that the PMM is robust against H while the PDM can be seriously suppressed by H, due to the field induced Dy3+ spin realignment as proposed in Fig. 7. The ferrielectric lattice at H = 0 is shown in (b), which transfers into the lattice in (c) at H ≫ 0. This lattice in (c) is composed of the PMM sublattice shown in (d) plus the PDM sublattice shown in (e). P = PDM + PMM.

