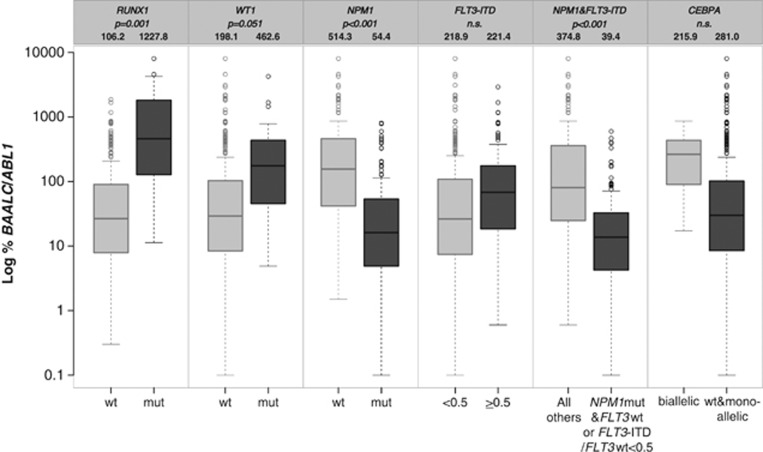
Figure 1.
Box plot of BAALC expression levels across different genetic subgroups. Mean %BAALC/ABL1 expression levels were compared with Student's t-test. Depicted are BAALC expression levels in RUNX1, WT1, NPM1, FLT3-ITD, NPM1&FLT3-ITD, and CEBPA mutated and wt cases separately. Also mean %BAALC/ABL1 values are given in the heading of the respective genetic subgroups.

