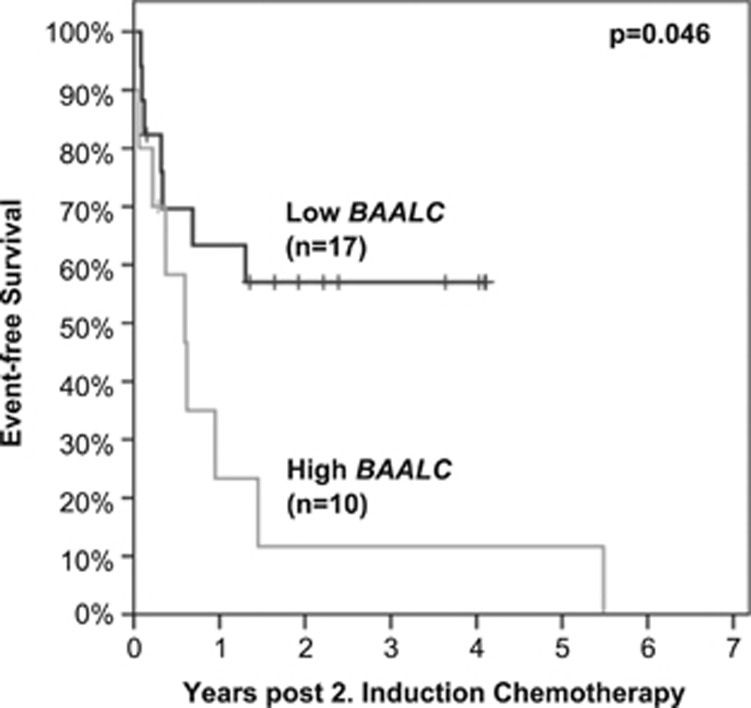
Figure 6.
Kaplan–Meier plot of patients achieving low vs high BAALC expression levels after second cycle of induction chemotherapy. To separate low (black) from high (gray) BAALC expressers the median BAALC expression level (33.1%BAALC/ABL1) of the diagnostic cohort was used. This resulted in significant differences in EFS (median: not reached vs 218 days, P=0.046).

