Figure 1.
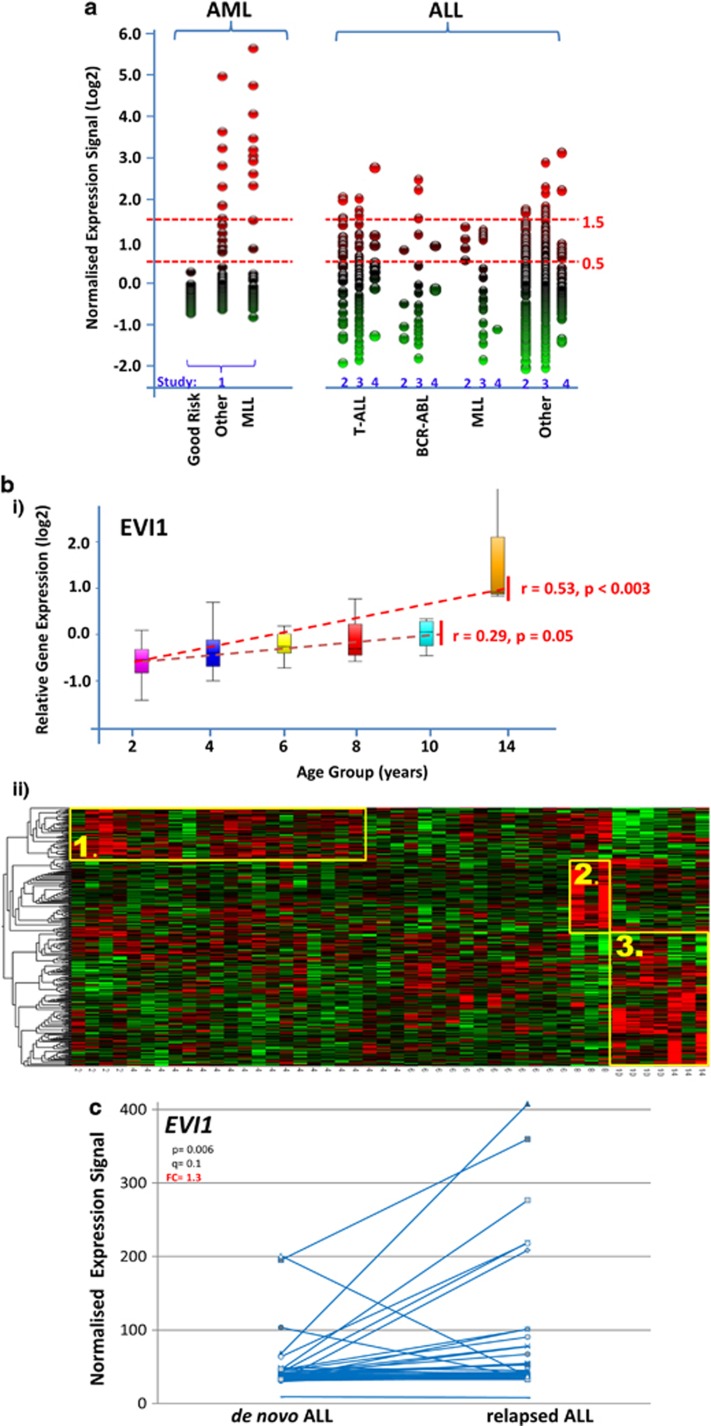
(a) Variability of EVI1 expression in paediatric leukaemia. Comparison of EVI1 expression of using the 221884_at Affymetrix gene probe. In an AML data set (1 GSE17855, n=237), Good Risk=good risk cytogenetics inv(16), t(15;17) and t(8;21) (n=74), Other=remaining cytogenetics (n=116) and MLL=MLL gene rearrangement-positive (n=47). The comparison shows three data sets of ALL (two GSE 13425 (n=190), three GSE28497 (n=255) and four Manchester (n=62)); BCR–ABL=BCR–ABL fusion (Philadelphia)-positive (n=5, n=16, n=3); T-ALL=T-cell ALL (n=36, n=45, n=9); MLL=MLL gene rearrangement-positive (n=4, n=18, n=1), Other=other ALL (n=145, n=176, n=49). (b) Age-associated gene expression in ALL panel (I). Age-related expression of EVI1 as measured by 221884_at Affymetrix gene expression probe set in 46 individuals with ALL (4.1, 1.1–13.0 years of ages (median, range); 23 female individuals); T-ALL, BCR–ABL and MLL-rearranged groups were removed. Box plot by age group (upper limit of bin shown), dotted line=median, whiskers show top and bottom quartiles. Rank regression by age, P-value and r-value shown. Panel (II) Heat map of age-associated changes in gene expression from cells obtained from diagnostic bone marrow aspirates of 46 individuals with ALL. Gene probe sets associated with age by multigroup analysis of variance with gender as covariate, P<0.01, identifying 415 probe sets as age related corresponding to 341 unique genes. Unsupervised hierarchical clustering using Euclidean metric with each variable normalised to mean 0 and variance 1. The horizontal axis ranked by age group (in years), age-related clusters derived from the dendrogram (vertical axis) highlighted in yellow; cluster 1=infancy/early childhood, cluster 2=late childhood, cluster 3=late childhood/puberty. Age specificity of clusters was confirmed using random substitution of probe sets (Qlucore Omics Explorer 2.3). (c) EVI1 expression in paired samples of de novo and relapse of ALL. Comparison of gene expression at diagnosis and at relapse of ALL from GSE28460 (Hogan et al.11). Expression of EVI1 was measured using the 221884_at Affymetrix gene probe set. Affymetrix gene expression microarray data normalisation was confirmed using multidimensional scaling in Qlucore Omics Explorer 2.3 and analysis of gene expression change was undertaken using a paired t-test with gender as an eliminated factor; q=false discovery rate-modified P-value, FC=fold change.

