Figure 3.

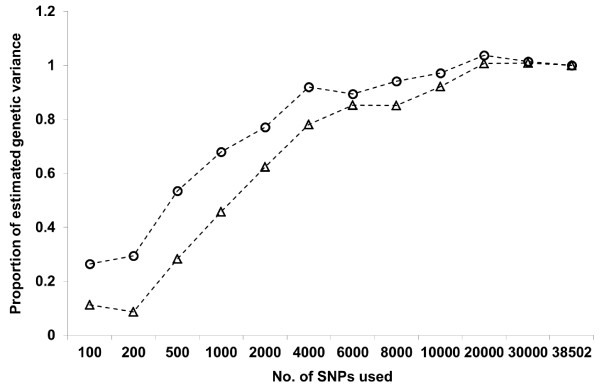
Changes in proportions of estimated genetic variances in model 1, with increasing density of SNPs used to construct G matrix. Circles: carcass weight; triangle: marbling score.

Changes in proportions of estimated genetic variances in model 1, with increasing density of SNPs used to construct G matrix. Circles: carcass weight; triangle: marbling score.