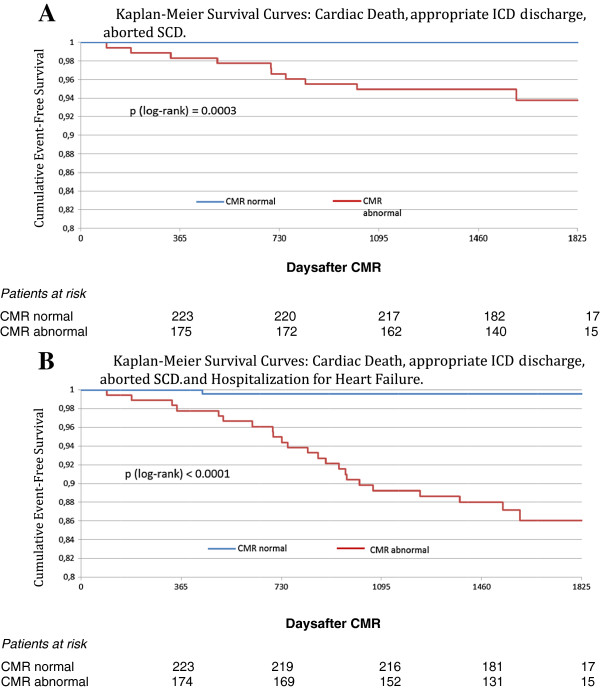
Figure 5.
Kaplan-Meier survival curves with regard to cardiac death, appropriate ICD discharge, aborted SCD (A), and cardiac death, appropriate ICD discharge, aborted SCD and hospitalization for heart failure (B). The number of patients at risk is shown at the bottom of the figures. Abbreviations as in Table 1.

