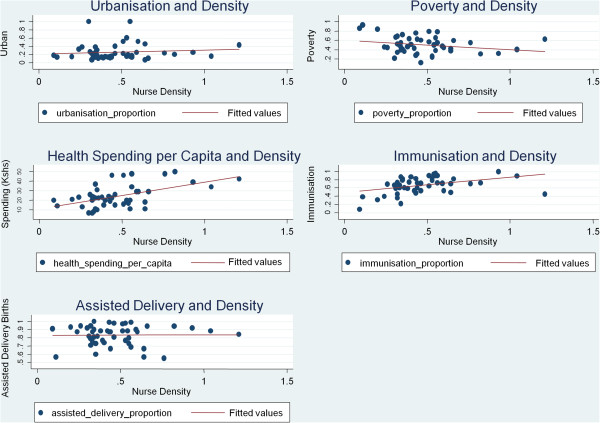
Figure 7.
Public sector nursing densities against selected county indicators. The scatter plots of five selected county indicators (urbanization, poverty rates, health spending per capita, immunization rates, and delivery care provided by a skilled provider) plotted against the public sector nursing densities across the counties (n = 47) are shown, with corresponding fitted trend lines.

