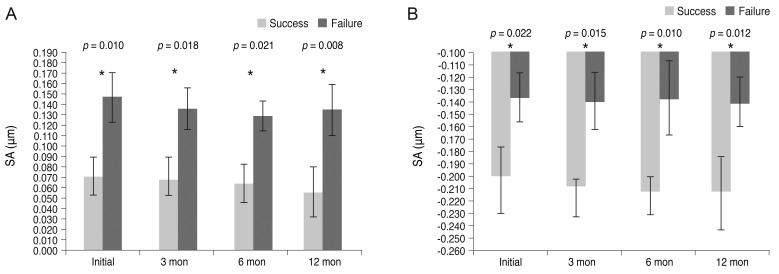
Fig. 2.
Comparisons of ocular and internal spherical aberrations (SAs) in amblyopic eyes according to the results of amblyopia treatment (A, ocular SA root mean square [RMS]; B, internal SA RMS). When comparing the two groups (success and failure groups), the ocular SA and internal SA of amblyopic eyes were significantly higher in the failure group at every follow-up (*p < 0.05, statistically significant, Mann-Whitney U-test).

