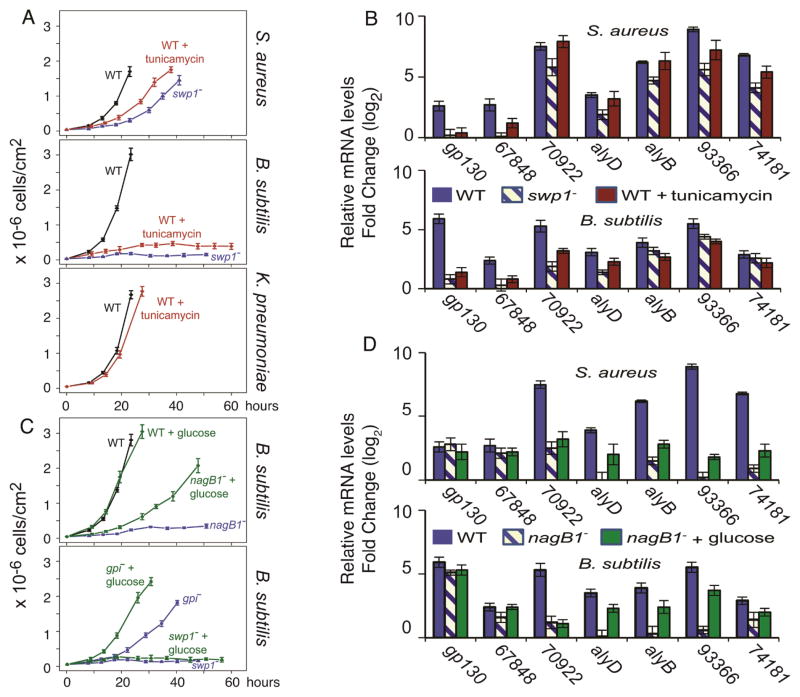
Figure 4. Two distinct pathways in amoebae for handling Gram(+) bacteria.
a, Growth curves of WT amoebae, WT treated with tunicamycin, and swp1− mutant on S. aureus (top) or B. subtilis (middle), and WT or WT treated with tunicamycin on K. pneumoniae (bottom). b, Relative abundance of mRNA (determined by qRT-PCR) of Gram(+)-enriched genes in WT amoebae, WT treated with tunicamycin, and the swp1− mutant on S. aureus (top), or B. subtilis (bottom) normalized to mRNA levels measured during growth on K. pneumoniae. Legend provided within the panels and the gene names are below the respective bars. c, Growth curves of WT and Gram(+) defective mutants grown on Gram(+) bacteria with or without glucose The axes are as in a. d, relative abundance of mRNA levels (determined by qRT-PCR) of Gram(+)-enriched genes in WT, nagB1− mutants, and nagB1− mutant treated with glucose on S. aureus (top) or B. subtilis (bottom) normalized to mRNA levels measured during growth on K. pneumoniae, as in b.

