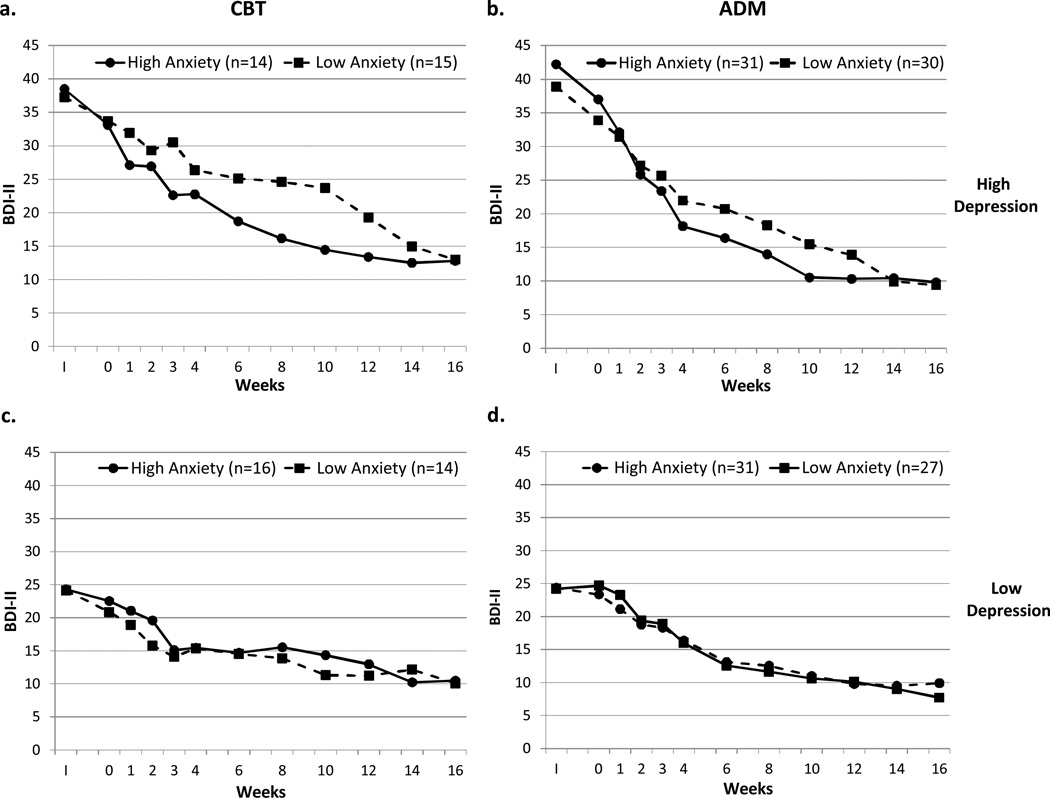
Figure 1.
Change in Depression in CBT and ADM for High and Low Intake Anxiety Plotted for High Intake Depression (top row) and Low Intake Depression (bottom row)
Note. a. CBT High Depression: High Anxiety vs. Low Anxiety, b. ADM High Depression: High Anxiety vs. Low Anxiety, c. CBT Low Depression: High Anxiety vs. Low Anxiety, d. ADM Low Depression: High Anxiety vs. Low Anxiety. I = intake assessment. Missing data were interpolated using adjacent data points. High and Low Depression groups (top and bottom rows) were created via a median split. High and Low Anxiety groups (solid and dashed lines) were created via a median split within each depression group.

