
Table 2.
Overview of S1 efferent projections.
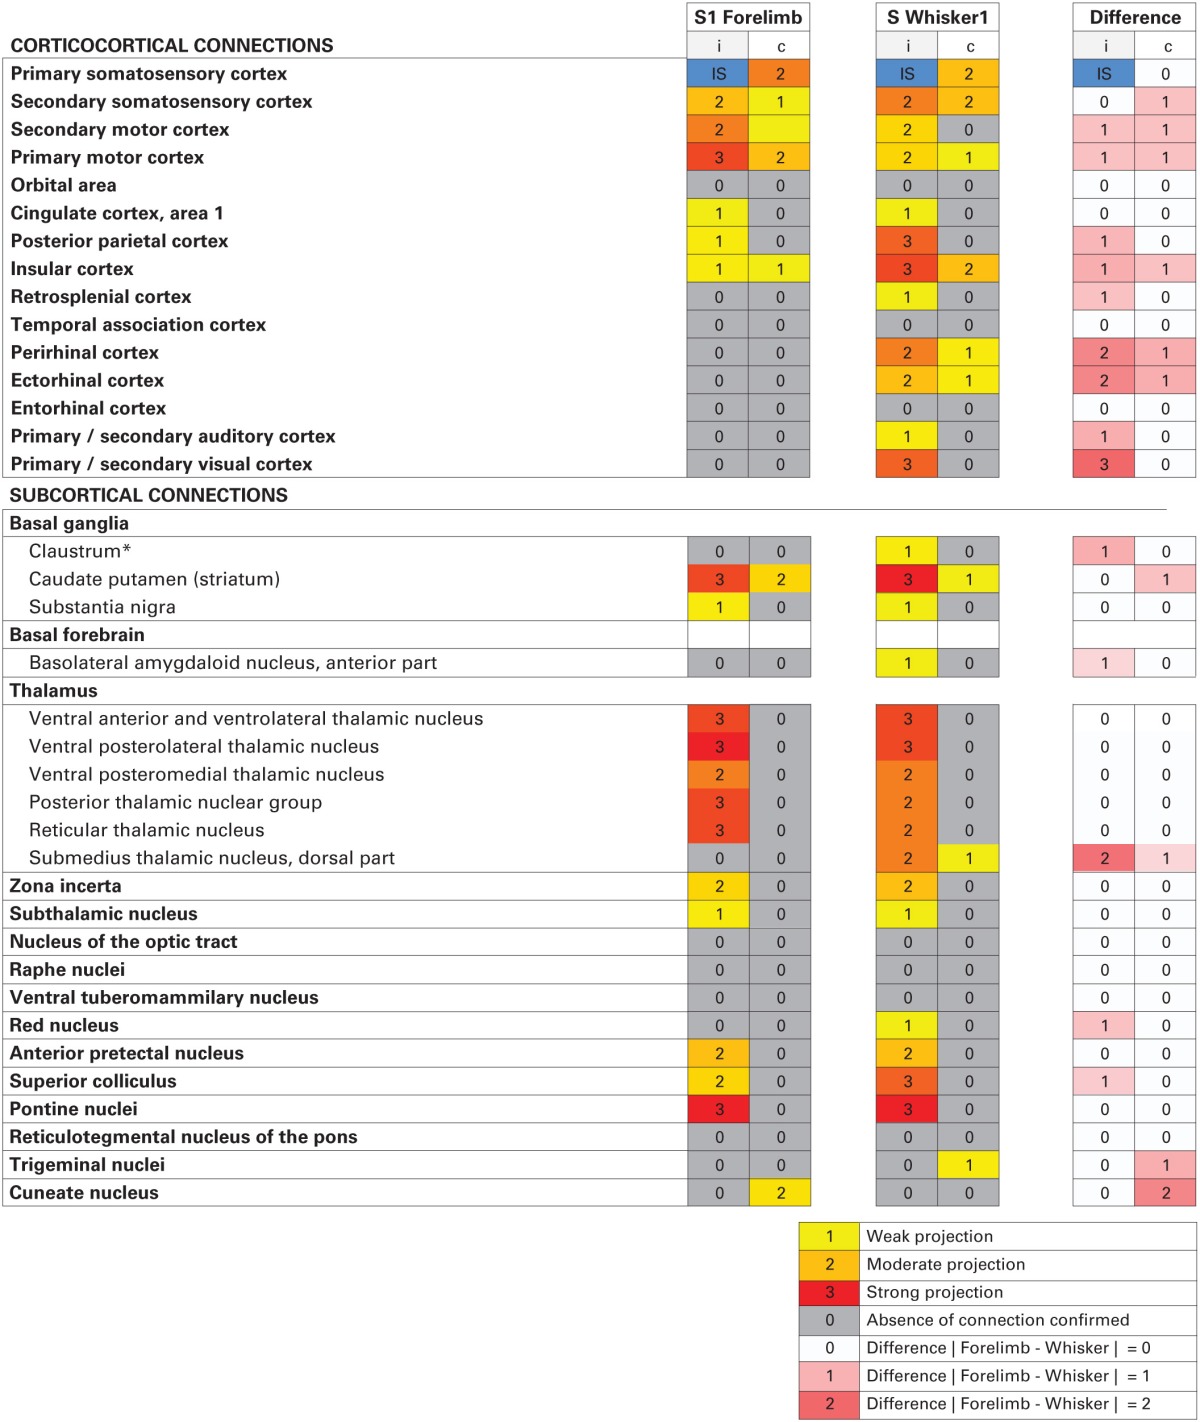
Columns 1 (S1 forelimb) and 2 (S1 whisker) show average projections (with color-coded strength) observed in the present study, cumulated from all six cases (Table 1). Column 3 shows the difference between the semiquantitative projection scores from S1 whisker and forelimb representations, such that 0 indicates no difference, while numbers 1–3 indicate degrees of difference.