Figure 1.

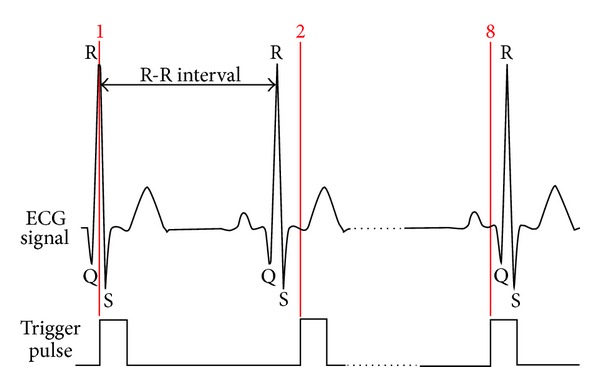
Eight distinct points with respect to QRS peak where the images were captured. Illustration of the trigger pulse and ECG signal at points 1, 2 (1/8 R-R interval time delay), and 8 (7/8 R-R interval time delay).

Eight distinct points with respect to QRS peak where the images were captured. Illustration of the trigger pulse and ECG signal at points 1, 2 (1/8 R-R interval time delay), and 8 (7/8 R-R interval time delay).