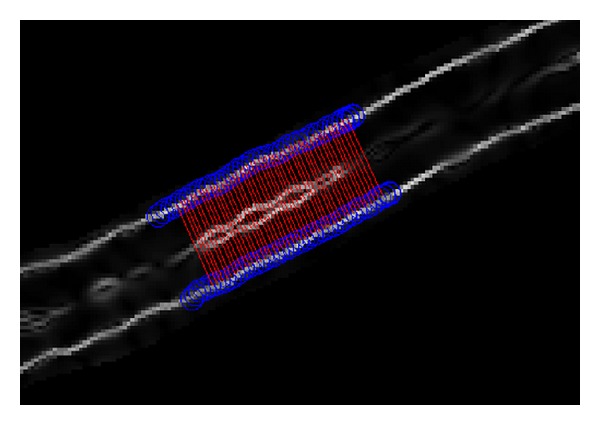
Figure 4.

Boundary tracking of a sample vessel segment using the masked vesselness image with highlighted boundaries. The blue circles are the tracked boundaries and the red lines are the shortest Euclidean distance between the two boundaries. The average lengths of these lines are considered as the diameter of the vessel segment on the selected ROI.
