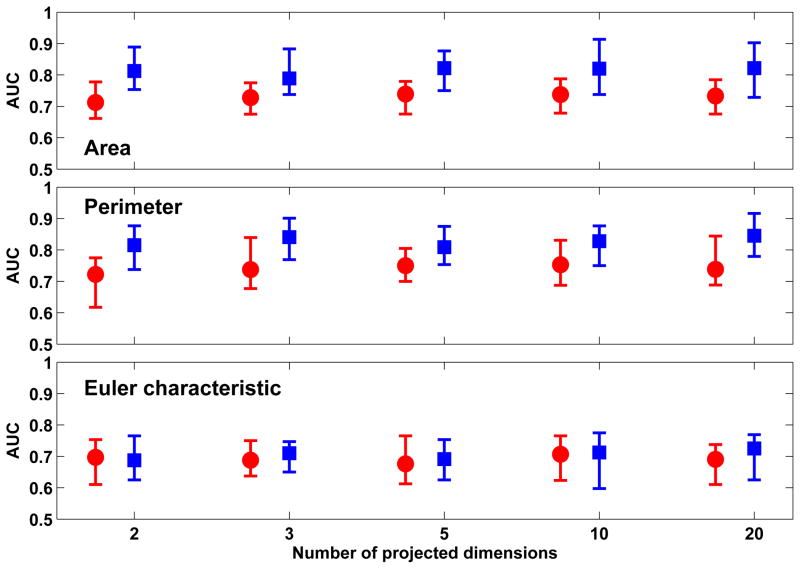
Figure 5.
Comparison of classification performance achieved with Minkowski functionals when Sammon’s mapping is used in conjunction with out-of-sample extension through Shepard’s interpolation (red) and RBFN-FA (blue) for different numbers of projected dimensions in the low-dimension space. For each distribution, the central mark corresponds to the median and the edges are the 25th and 75th percentile. The best results are obtained with ’area’ and ’perimeter’ with RBFN-FA for a 20-D low-dimension representation; however, comparable performance is also achieved with 2-D and 3-D representations.

