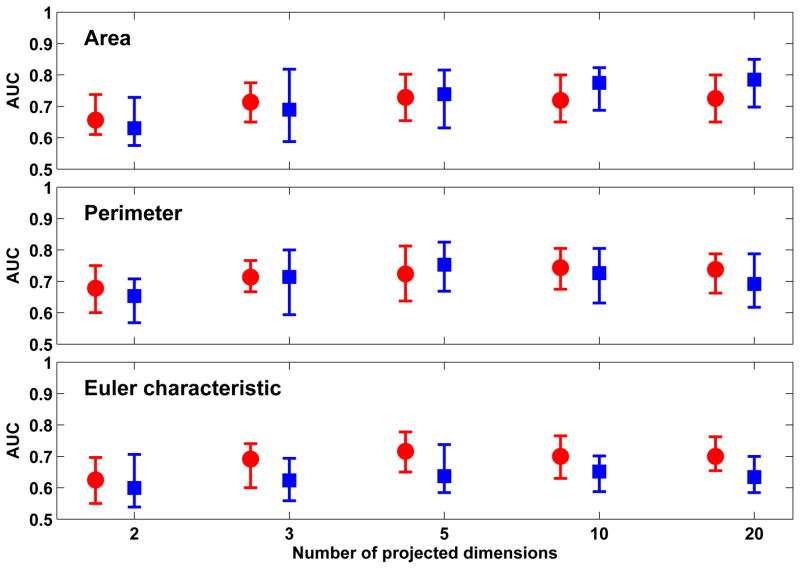
Figure 7.
Comparison of classification performance achieved with Minkowski functionals when t-SNE is used in conjunction with out-of-sample extension through Shepard’s interpolation (red) and RBFN-FA (blue); and for different number of projected dimensions in the low-dimension space. For each distribution, the central mark corresponds to the median and the edges are the 25th and 75th percentile. The best results are obtained with ’area’ and RBFN-FA for a 20-D low-dimension representation.

