FIGURE 6.
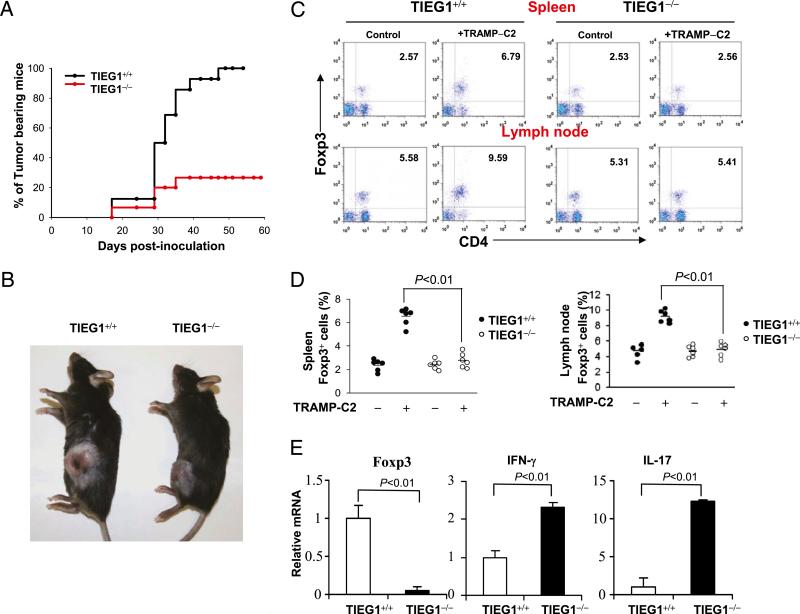
Elevated antitumor immune response in TIEG1–/– mice. A, Kaplan–Meier curves of tumor-bearing TIEG1+/+ mice (n = 16) and TIEG1–/– mice (n = 16). Male mice were injected s.c. with TRAMP-C2 cells. Tumors were monitored three times per week. Tumor incidence in each group was calculated from days 17–60. B, Representative image of tumor-bearing TIEG1+/+ and TIEG1–/– mice. The photograph was taken at day 60 after initial inoculation. C, Foxp3+ Tregs in the spleen (upper panels) and lymph nodes (lower panels) from tumor-bearing (+TRAMP-C2) or control mice (–TRAMP-C2) were analyzed using FACS following intracellular staining using anti-Foxp3 Ab. D, CD4+Foxp3+ cell numbers in the spleen and lymph nodes of TIEG1+/+ and TIEG1–/– mice. Each symbol represents an individual mouse. E, Tumor tissues were collected from TIEG1+/+ mice or TIEG1–/– mice, and Foxp3, IFN-γ, and IL-17 expression was analyzed by real-time PCR. The results shown are from one representative experiment that was conducted three times.

