Fig. 1.

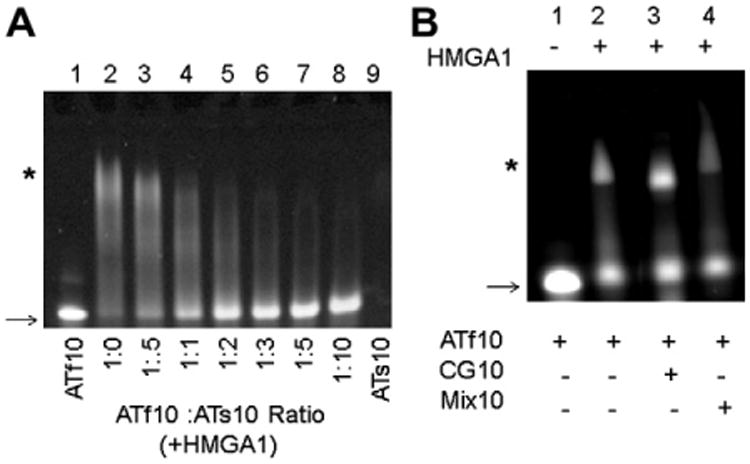
(A) EMSA of HMGA1 competitive binding assay using sDNA and unmodified DNA. Lanes 1 and 9 are controls, ATf10 and ATs10 respectively, that do not contain HMGA1. The ratios between HMGA1 and ATf10 were kept constant at 1.5 (excess HMGA1, lane 2) and an increased amount of ATs10 was added to the reactions in lanes 3–8. (B) EMSA of HMGA1 competitive binding assay using CG10 and Mix10 DNA. Lanes 2–4 contain equal amounts of ATf10 and CG10 or Mix10. ATf10 DNA: HMGA1 in lanes 2–4 was kept constant at a 1:1 ratio. The arrow indicates free (unshifted) DNA and the * indicates the complex (shifted bands) with ATf10 DNA. The image was taken at 495 nm using a BIO-RAD VersaDoc Imaging System Model 3000 in order to visualize the ATf10.
