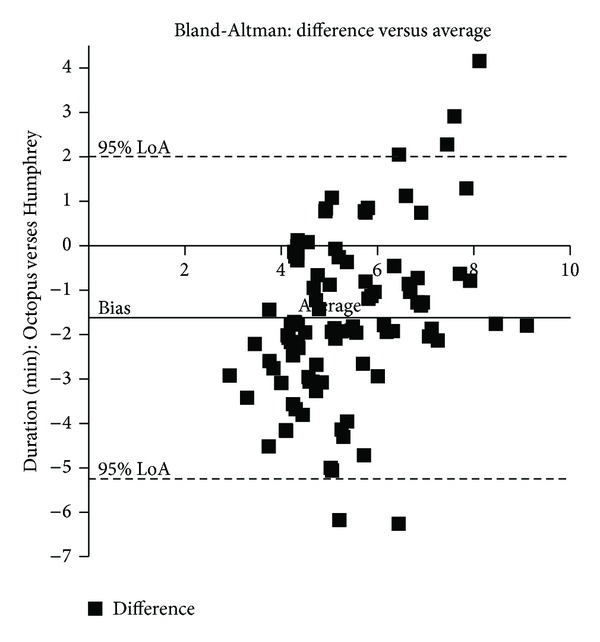
Figure 2.

Duration of assessment. The solid line represents the mean bias of −1.62 with a higher mean test duration for Humphrey perimetry compared to Octopus perimetry. The dotted lines represent ±1.96 SD (−5.25 to 2.01). Variability increases with longer test duration averages with Octopus perimetry having longer test times than Humphrey perimetry and vice versa.
