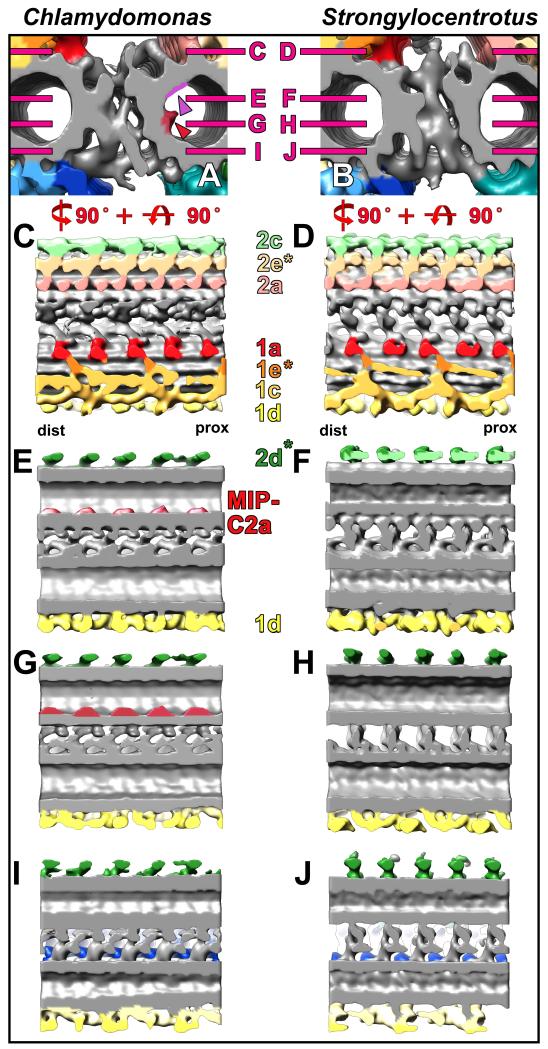
Fig. 5. Comparison of the C1-C2 bridge structures between Chlamydomonas and Strongylocentrotus.
(A-J) Isosurface renderings from CPC averages of Chlamydomonas (A, C, E, G, and I) and Strongylocentrotus (B, D, F, H, and J) display the bridge structure in cross-sectional (A, B) and four different longitudinal views observed from the top (C and D), middle (E-H), and bottom (I and J). A complex network with several distinct connections links the C1 and C2 MTs. It is apparent that some bridge components in Chlamydomonas are arranged diagonally (I) to the MT whereas they are arranged perpendicularly to the MT in Strongylocentrotus (J). All bridge structures appear to have a 16 nm periodicity. Note the positions of the two MT inner proteins MIP-C2a and MIP-C2b (red and purple arrowheads in A) that are only present in Chlamydomonas (A, E and G; see also Fig. 6), but absent from Strongylocentrotus (B, F and H). Magenta lines in (A and B) indicate the orientation of the longitudinal views shown in (C-J). Asterisks highlight newly designated projections and the proximal (prox) and distal (dist) side is indicated to facilitate orientation in (C and D).

