Figure 1.

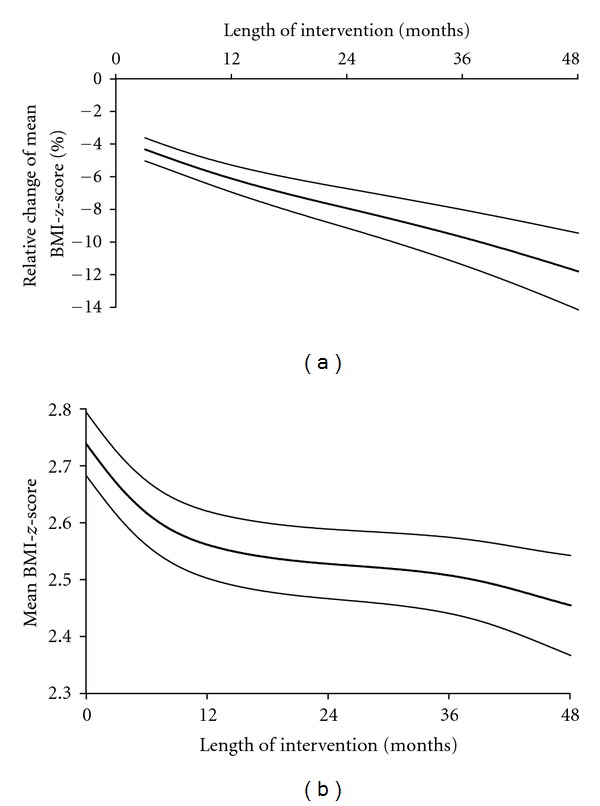
(a) Relative change (%) of mean BMI-z-score during intervention and (b) mean BMI-z-score during intervention. Data are expressed as mean ± SEM. BMI-z-score: body mass index-standard deviation score [8].

(a) Relative change (%) of mean BMI-z-score during intervention and (b) mean BMI-z-score during intervention. Data are expressed as mean ± SEM. BMI-z-score: body mass index-standard deviation score [8].