Figure 4.

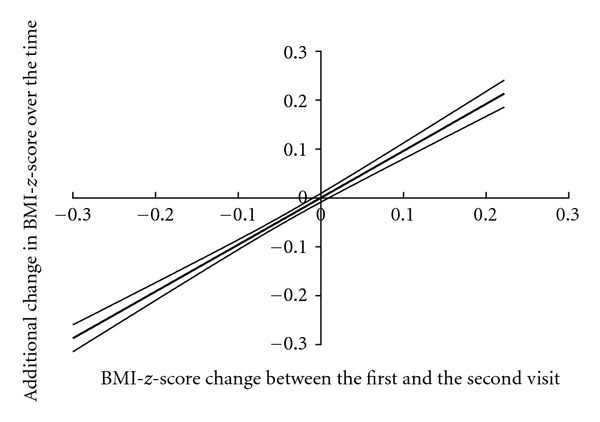
Additional change in BMI-z-score obtained in function of the change observed between the first and the second visit, controlled for the length of intervention. Data are expressed as mean ± SEM, bivariate analysis.

Additional change in BMI-z-score obtained in function of the change observed between the first and the second visit, controlled for the length of intervention. Data are expressed as mean ± SEM, bivariate analysis.