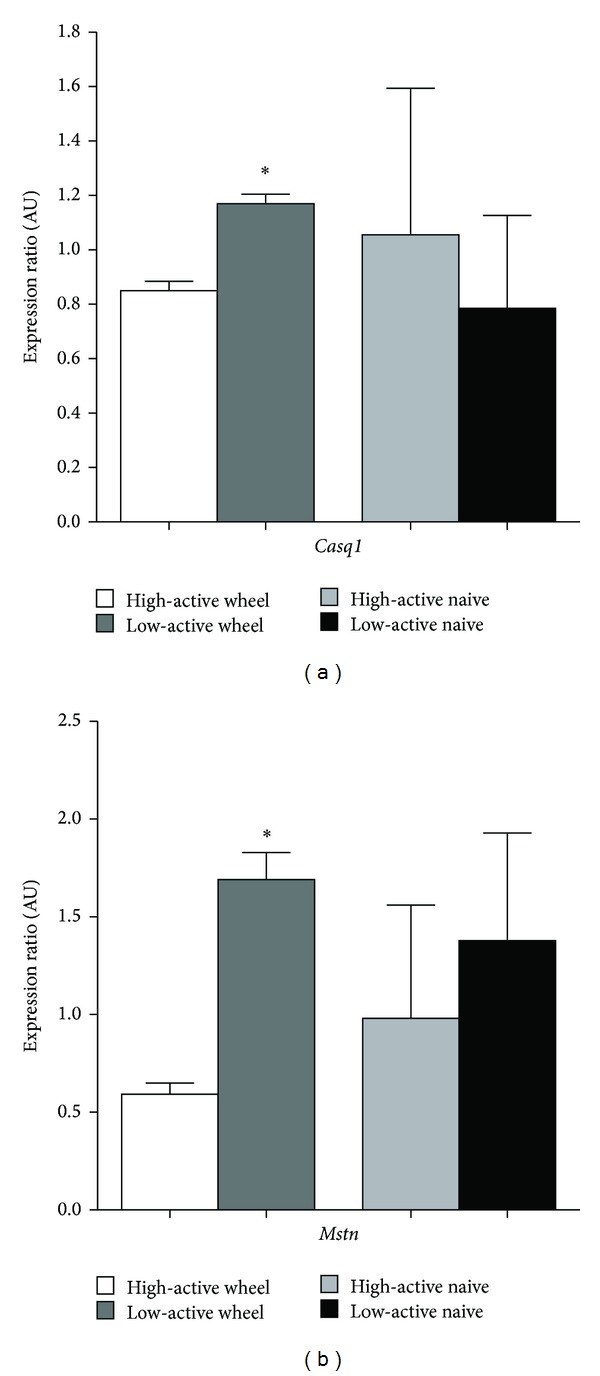
Figure 1.

Expression of Casq1 (a) and Mstn (b) in soleus muscle. In both panels, comparisons made between strains within activity state (high-active versus low-active). *Significantly different from wheel-exposed high-active mice (P < 0.05). Values are mean ± SD. AU, arbitrary units.
