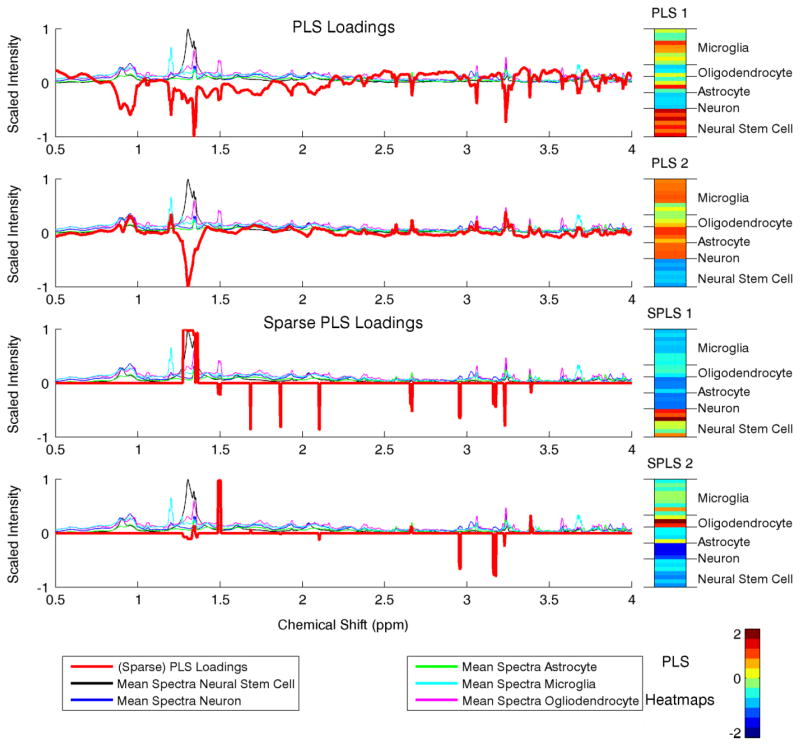
Fig. 2.
The first two PLS and Sparse PLS [4] loadings and sample PLS heatmaps for the neural cell NMR data. The loadings are superimposed on the mean scaled spectral intensities for each class of neural cells. [Color figure can be viewed in the online issue, which is available at wileyonlinelibrary.com.]

