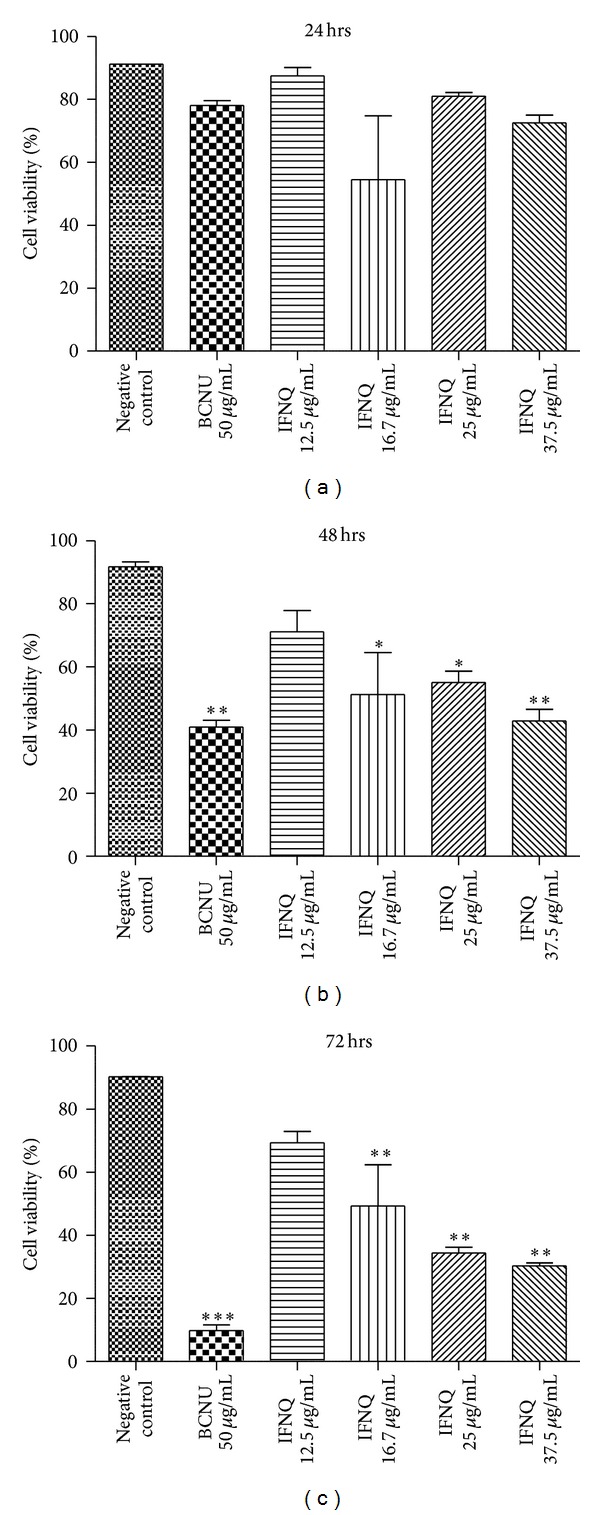
Figure 2.

The effects of different concentrations of IFNQ on Jurkat T cells. Different concentrations of IFNQ of 12.5 μg/mL, 16.7 μg/mL, 25 μg/mL and 37.5 μg/mL were used in individual wells and wells containing the negative control and positive controls (containing BCNU). Results are the mean of ± SD for n = 2 for duplicate measurements. ***P < 0.0001, **P < 0.001, and *P < 0.05.
