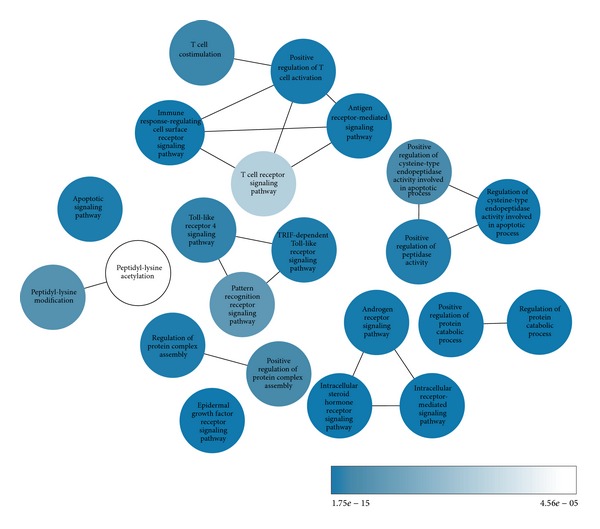
Figure 9.

Network of significantly enriched GO terms. This schematic network illustrates GO terms that were significantly enriched in the ND connector proteins, as well as the overlap between related terms. Node colors and inset bar indicate the P value for enrichment of each term, after correction for multiple testing.
