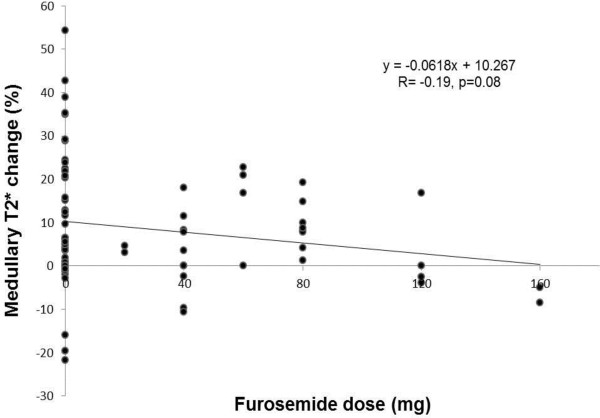
Figure 3.
Scatter plot demonstrating the relationship between daily oral furosemide dose (x-axis) and the percentage change in medullary T2* values after 20 mg intravenous furosemide (y-axis). The circular symbols (●) represent data from a single participant. The regression equation and line are displayed. The asterisk (*) represents p <0.05.

