Figure 1.

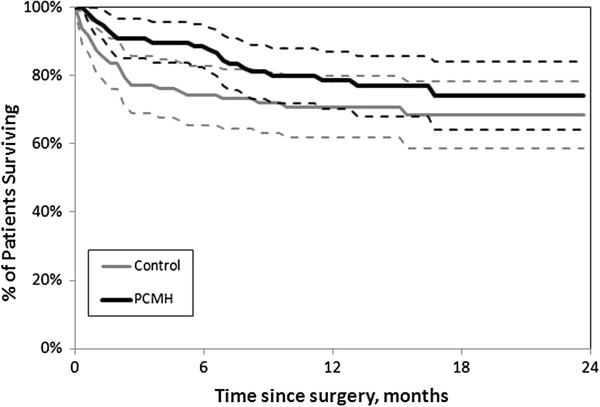
All-cause mortality survival curves for “Patient-Centered Medical Home” (PCMH) and control cohorts. Dashed lines around each curve represent 95% confidence intervals.

All-cause mortality survival curves for “Patient-Centered Medical Home” (PCMH) and control cohorts. Dashed lines around each curve represent 95% confidence intervals.