
Figure 1.
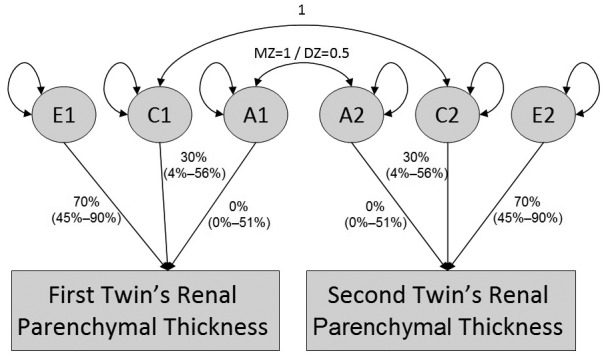
Univariate additive genetic (A), common environmental (C), and unique environmental (E) influences analysis of renal parenchymal thickness (RPT). Rectangles denote the observed variables (right and left RPT) and circles denote the latent variables of A, C and E. Curved arrows denote correlations (fixed at the highlighted values). Straight arrows signify the estimated impact of the latent factor on the variance of the observed phenotype.