Figure 1.
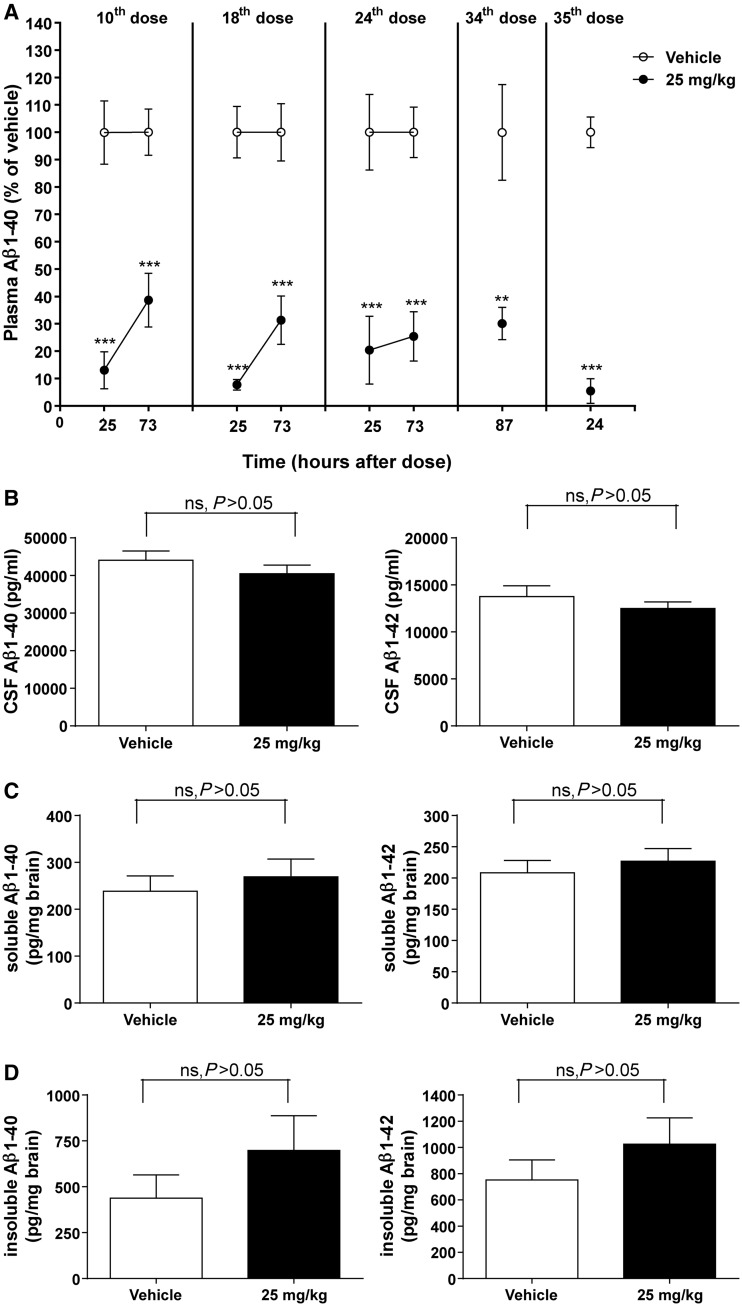
Amyloid-β1–40 (Aβ1–40) and/or amyloid-β1–42 (Aβ1–42) concentrations in plasma, CSF and brain of female Tg2576 mice after twice-weekly intravenous administration of MSA-mNEPv (0 and 25 mg/kg) for 4 months. (A) Mean (± SEM) amyloid-β1–40 concentrations in plasma (expressed as per cent of mean vehicle concentration at the equivalent time) after 5 weeks (10th dose), 9 weeks (18th dose), 12 weeks (24th dose) or 18 weeks (34th and 35th dose) of treatment (open circle = vehicle, filled circle = MSA-NEPv 25 mg/kg). Amyloid-β1–40 concentrations in vehicle-treated animals ranged from 520 to 9400 pg/ml. Samples were taken from 10–12 of 34–36 mice per treatment group at each time point in a rolling scheme such that each mouse was bled only once a month except at termination (24 h after the 35th dose) where all animals were sampled. ***P < 0.001; **P < 0.01. (B) Mean (± SEM) amyloid-β1–40 (left) and amyloid-β1–42 (right) concentrations in CSF. Samples were taken 24 h after the final dose. Data only presented for samples without blood contamination (n = 14–19 per group). ns = not statistically significant. (C) Mean (± SEM) soluble amyloid-β1–40 (left) and amyloid-β1–42 (right) concentrations in brain at 24 h after the final dose (n = 33–34 per group). (D) Mean (± SEM) insoluble amyloid-β1–40 (left) and amyloid-β1–42 (right) concentrations in brain at 24 h after the final dose (n = 33–34 per group).

