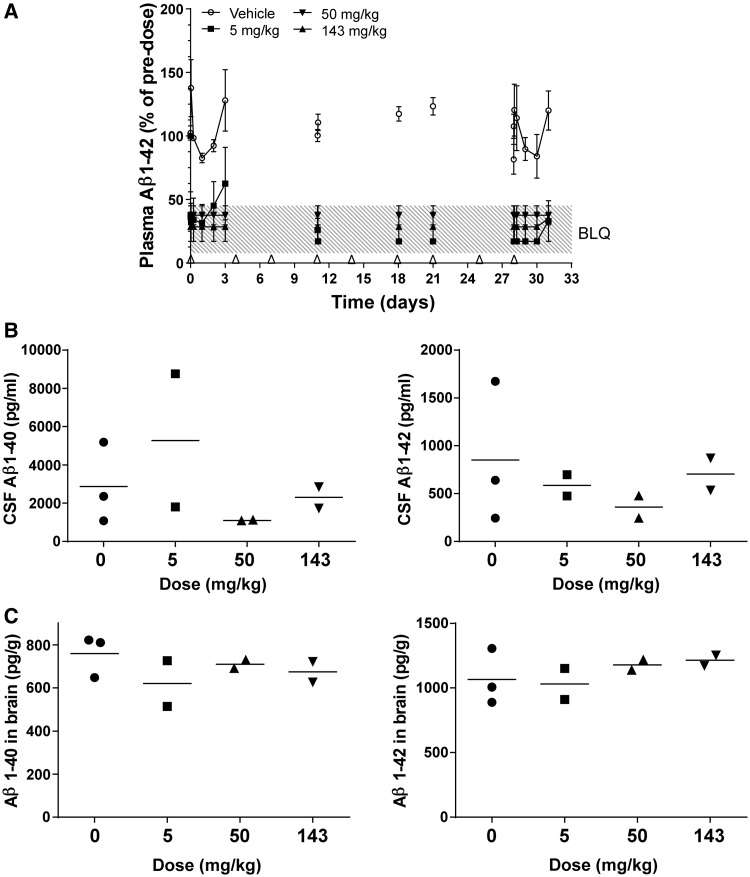
Figure 3.
Amyloid-β1–40 (Aβ1–40) and/or amyloid-β1–42 (Aβ1–42) concentrations in plasma, CSF and brain of male cynomolgus monkeys after twice-weekly intravenous administration of HSA-hNEPv (0, 5, 50 and 143 mg/kg) for 1 month. Only animals that maintained exposure to HSA-hNEPv to the end of the study (i.e. that did not develop clearing antibodies) are included (n = 3 animals/time point at 0 mg/kg and n = 2 at 5, 50 and 143 mg/kg). (A) Mean (± SEM) amyloid-β1–42 concentrations in plasma (expressed as per cent of pre-dose) at 0 (open circle), 5 (filled square), 50 (filled inverted triangle), and 143 (filled triangle) mg/kg. Arrows denote times of dosing. Amyloid-β levels on Day 11 are shown pre- and post-dose to illustrate the degree of suppression during the study. Pre-dose plasma amyloid-β1–42 concentrations ranged from 20–100 pg/ml. (B) Amyloid-β 1–40 (left) and amyloid-β1–42 (right) concentrations in CSF of individual animals at termination (Day 31, bar represents mean). (C) Soluble Aβ1–40 (left) and soluble amyloid-β1–42 (right) concentrations in brain of individual animals at termination (Day 31, bar represents mean). BLQ = below the limit of accurate quantification.

