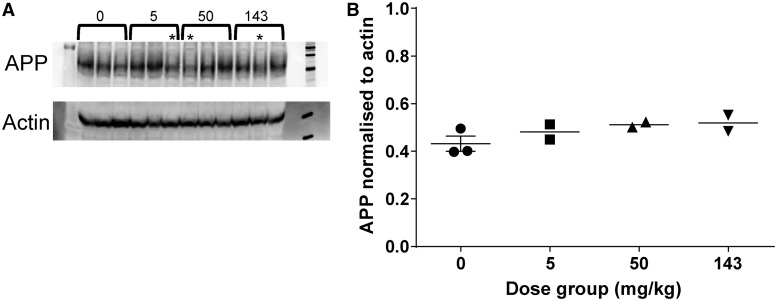
Figure 5.
Expression of APP in male cynomolgus monkeys after twice-weekly intravenous administration of HSA-hNEPv (0, 5, 50 and 143 mg/kg) for 1 month. (A) Protein extract from frontal cortex samples taken 3 days after the last dose (Day 31) analysed by western blot probed with anti-APP and anti-actin. Dose level (mg/kg) is indicated, asterisk indicates animals that lost exposure to the drug because of immunogenicity. (B) APP expression levels normalized to the signal from anti-actin. Signal intensity for APP and actin in the western blot were quantified and the APP signal divided by the actin signal. Only animals which maintained exposure to HSA-hNEPv to the end of the study (i.e. which did not develop clearing antibodies) are included (n = 3 at 0 mg/kg and n = 2 at 5, 50 and 143 mg/kg). Bar represents mean.

