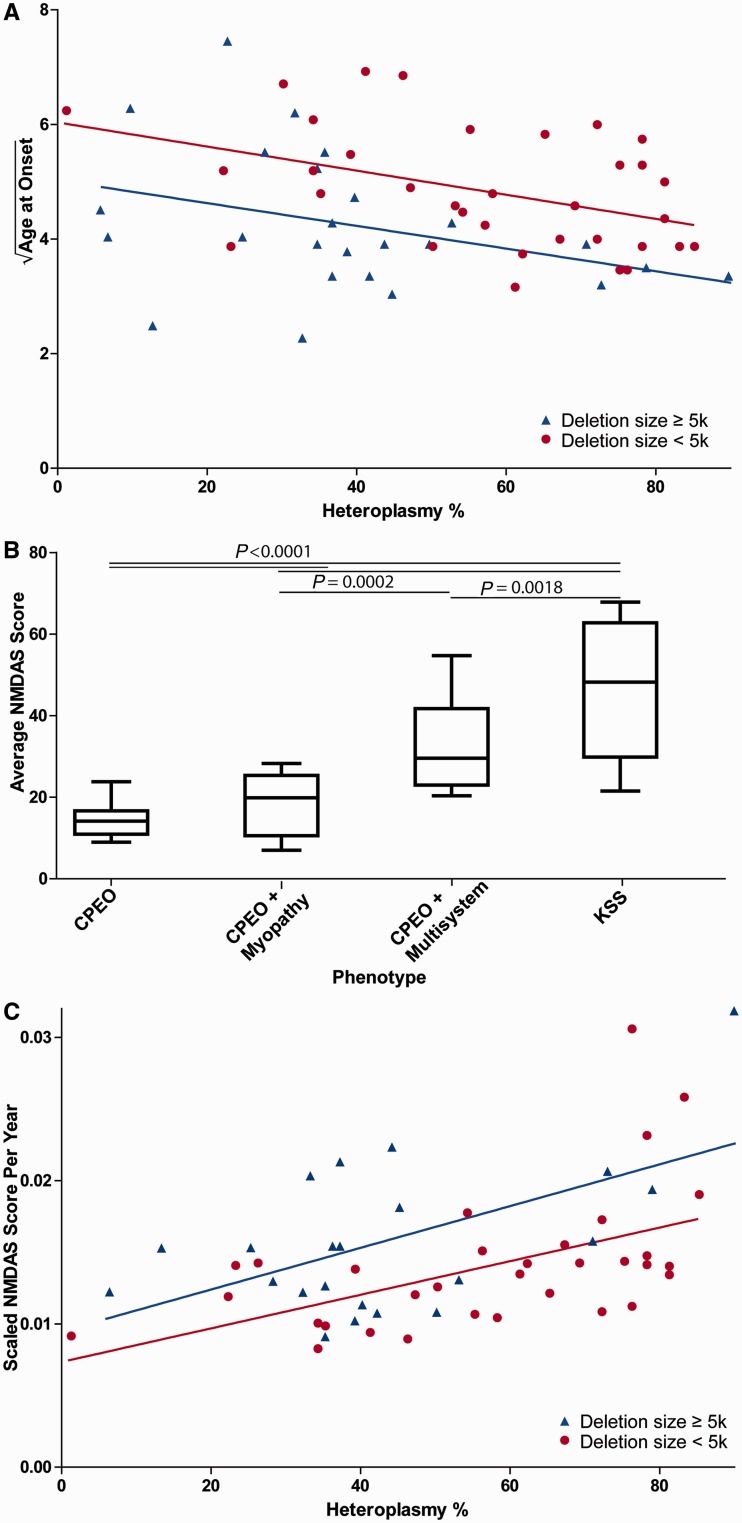
Figure 2.
Heteroplasmy and deletion size are linearly correlated with age at onset and NMDAS score progression. (A) Age at onset is predicted by both mitochondrial DNA heteroplasmy and deletion size. The y-axis shows the square root of age at onset. Data are from our cohort (n = 60, R2 = 0.18). Both mitochondrial DNA heteroplasmy (P = 0.0027) and deletion size (P = 0.0039) are significantly correlated with age at onset in our cohort using multiple regression. P-values are for both predictors as continuous variables, mitochondrial DNA deletion size is dichotomous for visualization only. (B) Phenotype and average NMDAS score are highly significantly correlated (P < 0.0001). Individual comparison P-values are shown. (C) NMDAS progression (scaled NMDAS points per year) is highly significantly correlated with both mitochondrial DNA deletion size (P < 0.0001) and heteroplasmy (P < 0.0001) (n = 55, R2 = 0.49). The y-axis shows scaled NMDAS score per year. P-values are for both predictors as continuous variables, deletion size is dichotomous for visualization only. KSS = Kearns-Sayre syndrome.

