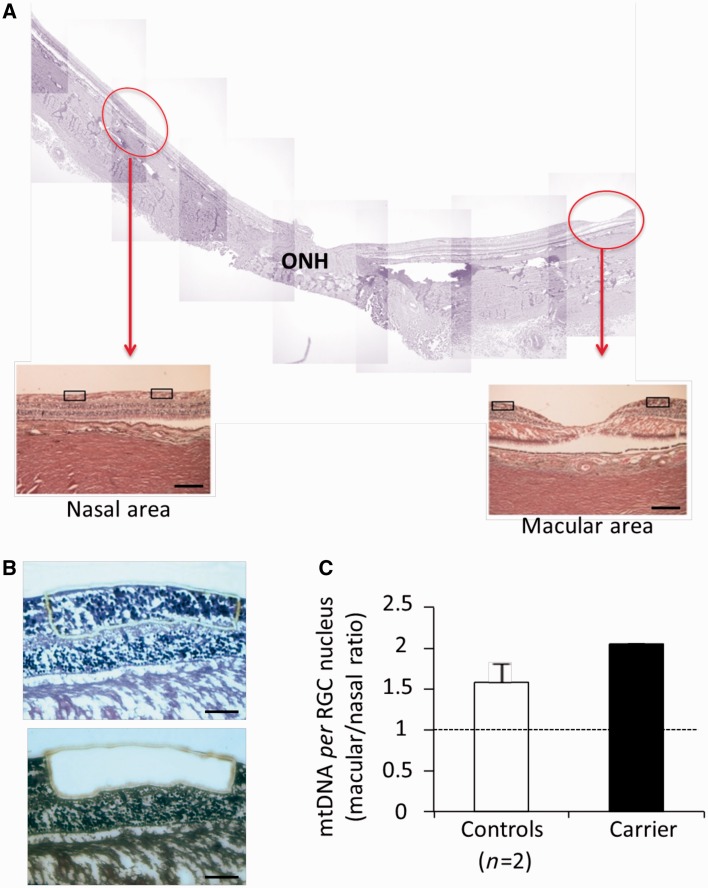
Figure 8.
Mitochondrial DNA content in retinal ganglion cells and nerve fibres from the macular and nasal retina. (A) Representative montage of horizontal sections through the optic nerve head (ONH) and the macula. Red circles indicate the macular and a nasal area, at equal distance from the optic nerve head, where retinal ganglion cells and the corresponding axons of the RNFL were microdissected by laser capturing for mitochondrial DNA copy number evaluation in two controls and one carrier (haematoxylin and eosin, scale bar = 200 μm). (B) Representative image of a retina before and after microdissection of retinal ganglion cells (RGC) and RNFL (haematoxylin and eosin, scale bar = 100μm). (C) The macular/nasal mitochondrial DNA ratio indicates that the mitochondrial DNA content (expressed as mitochondrial DNA copy per retinal ganglion cell nucleus) from the macular region is higher as compared with the nasal region. This ratio was even higher in the carrier. Data are mean ± SD from two experiments.

