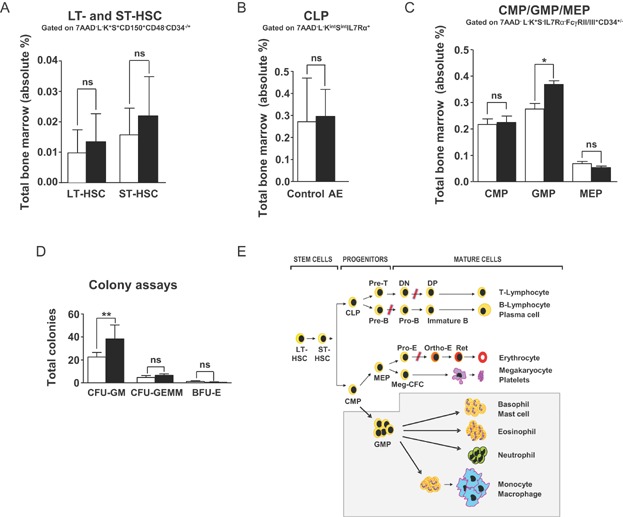
Figure 2.
AE expression specifically increases GMP.* p < 0.05; ** p < 0.01; ns, not significant.
Flow cytometric analysis of LT- and ST-HSC showing the absolute percentages ± SD obtained from control (white bars) and DOX-induced mice (black bars).
Flow cytometric analysis of CLP showing the absolute percentages ± SD of CLP cells in the BM of control (white bar) and AE-induced mice (black bar).
Flow cytometric analysis of GMP, CMP and MEP showing the absolute percentages ± SD of each progenitor cell type in the BM of control (white bars) and AE-induced mice (black bars).
Colony forming assay of BM cells from controls (white bars) and mice that had been DOX-induced during eight months (black bars). Bars represent the mean values ± SD for three individual mice. Granulocyte macrophage (CFU-GM), mixed haematopoietic (CFU-GEMM) and erythroid burst-forming (BFU-E) colonies are shown. Two-tailed unpaired t-test analysis demonstrated significant differences in CFU-GM (p = 0.0015) but not in CFU-GEMM (p = 0.1099) and BFU-E (p = 0.0519) colony numbers between control and AE-induced BM cells.
Overview of developmental alterations following AE expression for more than 6 month. Red slashes indicate impaired lineage maturation. A grey background marks the expanded myeloid compartment.