Figure 3.
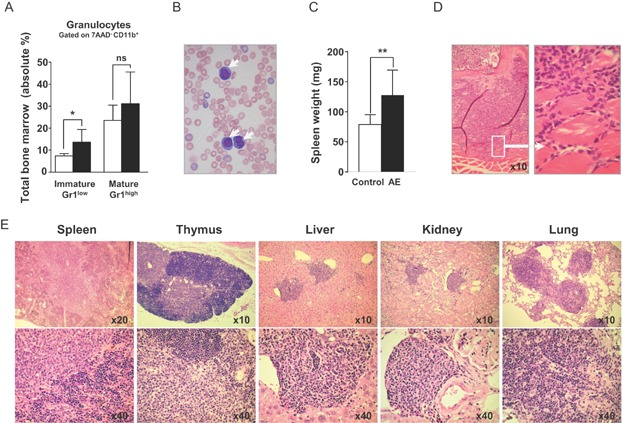
Long-term AE expression induces leukaemia. With the exception of Fig 3D data shown was obtained from long-term reconstituted mice without DOX or animals that have been exposed to DOX for 16–18 months. * p < 0.05; ** p < 0.01; ns, not significant.
The absolute percentages ± SD of immature Gr1low and mature Gr1high granulocytic cells in the BM of reconstituted controls (white bars) and DOX-induced mice (black bars) are shown.
Peripheral blood film from an AE-expressing mouse with blasts (arrows).
Bar diagram showing the spleen weight ± SD from eight control (white bar) and eight long-term induced (black bar) mice. Two-tailed unpaired t-test analysis demonstrated significant differences in spleen weight between control and AE-induced mice (p = 0.0052).
Images show sections through the bone marrow (BM) of the spinal cord taken from a mouse that was DOX-induced during 22 months. The left image shows an overview and the right picture a magnification revealing the invasion of leukaemic cells into the surrounding muscle tissue.
Representative H&E-stained organ sections from leukaemic mice demonstrating the invasion of cells into spleen, thymus, liver, kidney and lung. Pictures at the bottom show a detail of the above image at a higher magnification.

