Figure 7.
RNA-Seq whole transcriptome analysis.
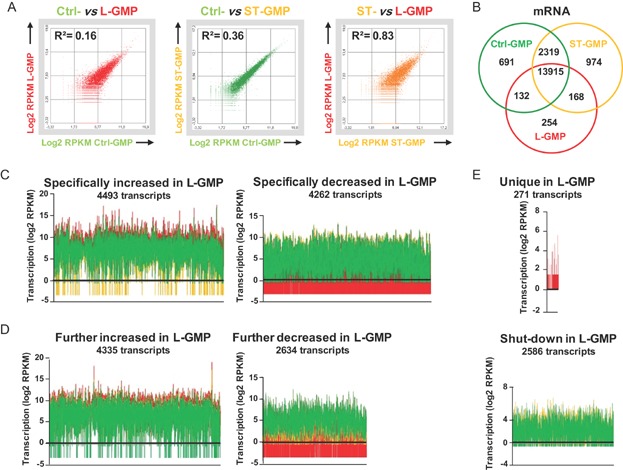
Scatter plots of Ctrl- versus L-GMP (left plot), Ctrl- versus ST-GMP (central plot) and ST- versus L-GMP (right plot) transcriptomes. R2, Pearson's correlation value; Ctrl, control; ST-, short-term; L-GMP, leukaemic-GMP; RPKM, reads per kilobase of exon model per million mapped reads.
Venn diagram with commonly and differentially transcribed mRNAs. Numbers of individual mRNA transcripts are indicated.
Transcription of genes that were specifically increased (left plot) or decreased (right plot) only in the L-GMP population. The transcriptional activity is shown as log2 RPKM values. L-GMP transcripts are indicated in red, ST-GPM transcripts are depicted in orange and control GMP transcripts are represented in green.
Transcription of genes that were already up- or downregulated in ST-GMP and further increased (left plot) or decreased (right plot) in the L-GMP population.
Transcriptional profiles of genes that are uniquely expressed (above) or specifically shut down (below) in L-GMP.

