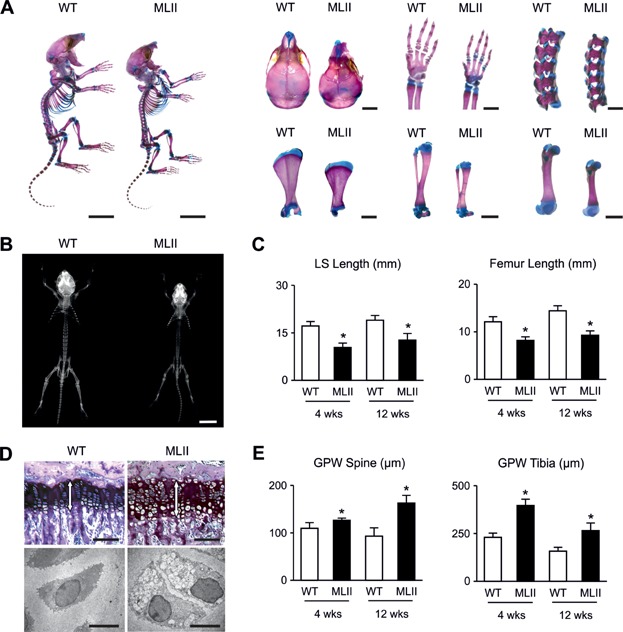
Figure 1.
MLII mice are retarded in growth.
Alcian blue/alizarin red staining of the whole skeleton from 7-day-old WT and MLII littermates and magnified images of crania, forelimbs, spines, scapulae, tibiae and femurs. Scale bars: 1 cm, 2 mm.
Contact radiographs of whole skeletons at 4 weeks of age. Scale bar: 1 cm.
Quantification of lumbar spine (LS) and femoral length of 4- and 12-week-old mice. Data are shown as mean and SD (n = 5 mice per group). *p (LS, 4 weeks) = 0.0001, *p (LS, 12 weeks) = 0.0041, *p (Fe, 4 weeks) = 0.0002, *p (Fe, 12 weeks) = 0.0003 for WT versus MLII by independent Student's t-test.
Toluidine blue-stained sections from tibiae of 12-week-old mice. The white arrows in each panel indicate the growth plate (top). Scale bars: 100 µm. Ultrastructural analysis of chondrocytes from tibiae of 12-week-old mice (bottom). Scale bars: 5 µm.
Quantification of growth plate width (GPW) from spine and tibia of 4- and 12-week-old mice. Data are shown as mean ± SD (n = 5 mice per group). *p (Spine, 4 weeks) = 0.0195, *p (Spine, 12 weeks) = 0.0012, *p (Tibia, 4 weeks) = 0.0001, *p (Tibia, 12 weeks) = 0.0051 for WT versus MLII by independent Student's t-test.