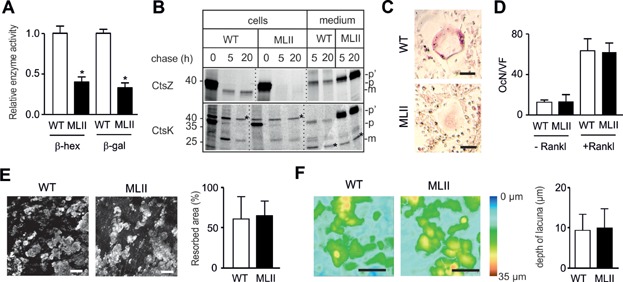
Figure 5.
Mistargeting of lysosomal hydrolases does not result in increased resorptive capacity of MLII osteoclasts.
Relative intracellular enzyme activity of lysosomal hydrolases β-hexosaminidase (β-hex) and β-galactosidase (β-gal) in primary cultured osteoclasts from MLII mice compared to WT. Data are shown as mean and SD (n = 3 primary cultures per group). *p (β-hex) = 0.0001, *p (β-gal) = 0.0001 for WT versus MLII by independent Student's t-test.
Primary cultures of osteoclasts from MLII and WT mice were incubated with [35S]-methionine for 1 h and either harvested (0 h) or chased for 5 and 20 h, followed by immunoprecipitation of lysosomal proteases CtsZ and CtsK from cell extracts and media (p, precursor posttranslational modified by high-mannose type N-glycans; p′, precursor modified with N-glycans processed to the complex type form, m, mature form).
Primary cultured osteoclasts from WT and MLII mice stained for TRAP activity.
Number of osteoclasts per visual field (OcN/VF) formed after 6 days of differentiation with 1,25(OH)2-vitamin D3 alone (−Rankl) (n = 6 primary cultures per group) or for the last 3 days in the additional presence of M-CSF and Rankl (+Rankl) (n = 3 primary cultures per group). Data are shown as mean and SD.
Quantification of area covered by resorption pits after 12-days-cultivation of osteoclasts on dentine chips. Scale bars = 50 µm. Data are shown as mean and SD (n = 3 primary cultures per group).
Topographic maps of resorption pits visualized by three dimensional stack imaging. Scale bars: 50 µm. Quantification of pit depth (WT, n = 275 pits; MLII, n = 285 pits). All values are mean and SD.